First Release
Year: LXII.
Zagreb, 29 August 2025
STAN-2025-3-1
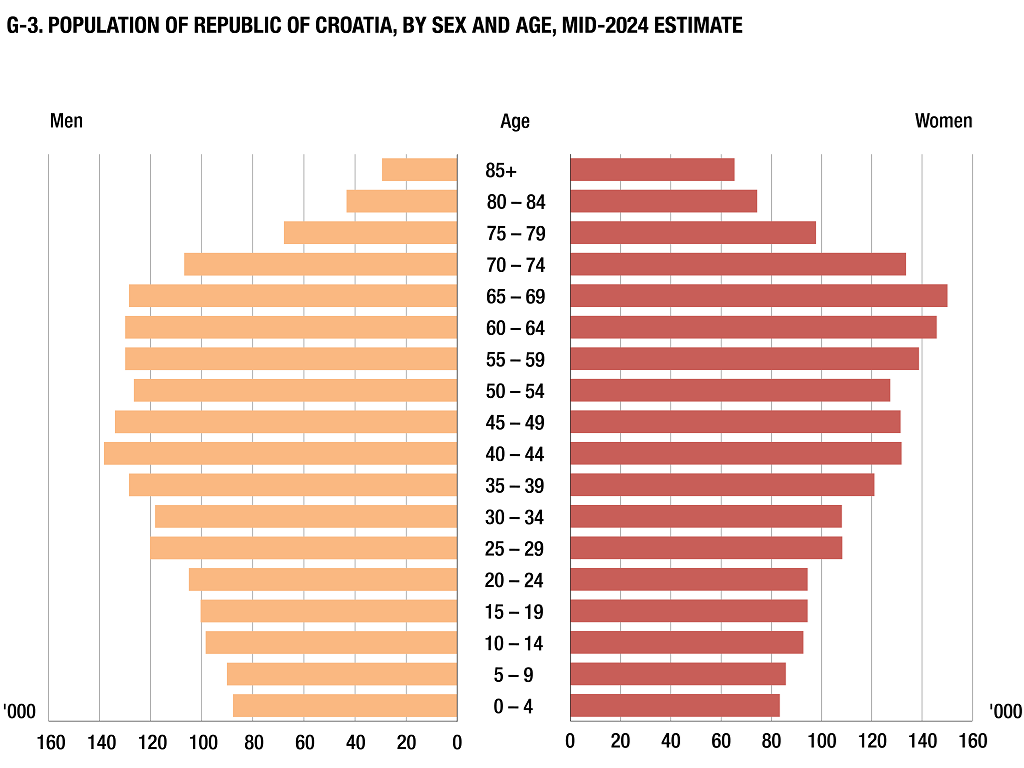
POPULATION ESTIMATE OF THE REPUBLIC OF CROATIA, 2024
According to the mid-2024 population estimate, the Republic of Croatia had 3 866 233 inhabitants, out of which there were 1 882 564 men and 1 983 669 women.
As compared to the previous year estimate, the population increased by 6 547 persons or 0.2%.
An increase in the total population was recorded in the County of Istria, where, as compared to the previous year estimate, a relative increase of 1.66% was recorded, in the County of Zadar (1.27%), the County of Zagreb (1.14%), the County of Lika-Senj (0.77%), the County of Split-Dalmatia (0.62%), the County of Dubrovnik-Neretva (0.47%), the City of Zagreb (0.41%), the County of Primorje-Gorski Kotar (0.25%), the County of Varaždin (0.17%) and the County of Međimurje (0.01%). A decrease in the total population was recorded in all remaining counties, and the highest relative decrease in the population was recorded in the County of Požega-Slavonia (1.51%), the County of Virovitica-Podravina (1.27%) and in the County of Vukovar-Srijem (1.15%).
The share of women in the total population of the Republic of Croatia was 51.3% and the share of men was 48.7%. The lowest share of female population was recorded in the County of Lika-Senj (50.2%), while the largest share was recorded in the City of Zagreb (52.5%).
In 2024, the continuous ageing of the population kept on. The average age of the total population of the Republic of Croatia was 44.5 years (men 42.8, women 46.2), which places it among the oldest nations in Europe.
The share of youth (0 – 19 years of age) in the total population of the Republic of Croatia amounted to 19.0%. At the county level, the lowest share of youth was recorded in the County of Primorje-Gorski Kotar (16.5%) and the highest one in the County of Međimurje (21.3%).
The share of the fertile contingent in the total female population amounted to 39.8% in 2024.
As compared to the total population, the largest number of persons aged 65 and over was recorded in the County of Šibenik-Knin (28.5%), while the smallest number was recorded in the City of Zagreb (20.8%).
In the Republic of Croatia, 52.5% of the population lived in only five counties, most of them in the City of Zagreb (774 225 or 20.0%) and in the County of Split-Dalmatia (428 680 or 11.1%), whereas the least populated counties were the County of Lika-Senj (43 058 or 1.1%) and the County of Požega-Slavonia (60 976 or 1.6%).
1 MID-YEAR TOTAL POPULATION ESTIMATE OF THE REPUBLIC OF CROATIA, BY COUNTIES, 2020 – 2024
|
| County of |
20201) |
20212) |
20222) |
20232) |
20242) |
| Republic of Croatia |
3 914 206 |
3 878 981 |
3 855 641 |
3 859 686 |
3 866 233 |
| Zagreb |
300 442 |
299 983 |
301 387 |
304 354 |
307 815 |
| Krapina-Zagorje |
121 535 |
120 670 |
119 862 |
119 409 |
119 204 |
| Sisak-Moslavina |
142 303 |
140 131 |
137 603 |
136 041 |
134 663 |
| Karlovac |
113 804 |
112 357 |
110 938 |
110 418 |
109 823 |
| Varaždin |
161 351 |
159 747 |
158 594 |
158 554 |
158 818 |
| Koprivnica-Križevci |
102 393 |
101 358 |
100 366 |
99 740 |
99 229 |
| Bjelovar-Bilogora |
103 806 |
102 205 |
100 397 |
99 352 |
98 596 |
| Primorje-Gorski Kotar |
269 333 |
266 183 |
264 267 |
264 572 |
265 223 |
| Lika-Senj |
43 582 |
42 931 |
42 578 |
42 731 |
43 058 |
| Virovitica-Podravina |
71 773 |
70 648 |
69 290 |
68 423 |
67 554 |
| Požega-Slavonia |
65 372 |
64 384 |
63 037 |
61 910 |
60 976 |
| Slavonski Brod-Posavina |
132 936 |
130 844 |
128 288 |
127 262 |
126 444 |
| Zadar |
160 861 |
160 085 |
160 239 |
162 255 |
164 323 |
| Osijek-Baranja |
262 519 |
258 719 |
255 175 |
252 885 |
250 767 |
| Šibenik-Knin |
97 859 |
96 722 |
95 719 |
95 711 |
95 622 |
| Vukovar-Srijem |
146 363 |
143 678 |
141 025 |
139 105 |
137 509 |
| Split-Dalmatia |
427 405 |
423 849 |
423 400 |
426 054 |
428 680 |
| Istria |
195 831 |
195 326 |
195 970 |
199 541 |
202 844 |
| Dubrovnik-Neretva |
116 642 |
115 714 |
115 049 |
115 370 |
115 912 |
| Međimurje |
106 120 |
105 393 |
105 012 |
104 937 |
104 948 |
| City of Zagreb |
771 976 |
768 054 |
767 445 |
771 062 |
774 225 |
|
G-1 SHARE OF POPULATION IN COUNTIES IN TOTAL POPULATION OF THE REPUBLIC OF CROATIA, MID-2024 ESTIMATE
Source: Croatian Bureau of Statistics
2 AVERAGE AGE, AGEING INDEX AND FERTILE CONTINGENT OF POPULATION OF THE REPUBLIC OF CROATIA
|
| |
Average age |
Ageing index, % |
Fertile contingent,
15 – 49, % |
| Total |
Men |
Women |
Total |
Men |
Women |
Women |
| 19711) |
34,0 |
32,4 |
35,5 |
47,2 |
38,5 |
56,2 |
51,4 |
| 19811) |
35,4 |
33,8 |
37,1 |
52,6 |
40,4 |
65,3 |
48,5 |
| 19911) |
37,1 |
35,4 |
38,7 |
66,7 |
50,8 |
83,3 |
46,6 |
| 20011) |
39,3 |
37,5 |
41,0 |
90,7 |
71,6 |
110,8 |
46,9 |
| 20111) |
41,7 |
39,9 |
43,4 |
115,0 |
92,3 |
139,0 |
43,9 |
| 20211) |
44,3 |
42,6 |
46,0 |
156,2 |
130,7 |
183,2 |
39,9 |
| 20222) |
44,3 |
42,6 |
46,0 |
156,1 |
130,6 |
183,1 |
39,8 |
| 20232) |
44,4 |
42,6 |
46,1 |
157,6 |
132,0 |
184,6 |
39,8 |
| 20242) |
44,5 |
42,8 |
46,2 |
160,0 |
134,3 |
187,2 |
39,8 |
|
G-2 SHARE OF POPULATION AGED 65 AND OVER IN TOTAL POPULATION, BY COUNTIES, MID-2024 ESTIMATE
Source: Croatian Bureau of Statistics
3 POPULATION ESTIMATE OF THE REPUBLIC OF CROATIA, BY SEX AND SINGLE AGE, MID-2024
|
| |
|
|
|
|
|
|
|
|
| Age |
Total |
Men |
Women |
|
Age |
Total |
Men |
Women |
| Total |
3 866 233 |
1 882 564 |
1 983 669 |
|
|
|
|
|
| 0 |
31 939 |
16 400 |
15 539 |
|
43 |
54 333 |
27 702 |
26 631 |
| 1 |
33 050 |
16 730 |
16 320 |
|
44 |
54 629 |
27 824 |
26 805 |
| 2 |
35 677 |
18 253 |
17 424 |
|
45 |
54 737 |
27 833 |
26 904 |
| 3 |
35 299 |
18 360 |
16 939 |
|
46 |
53 569 |
27 031 |
26 538 |
| 4 |
35 106 |
17 996 |
17 110 |
|
47 |
52 715 |
26 657 |
26 058 |
| 5 |
35 249 |
17 907 |
17 342 |
|
48 |
52 487 |
26 364 |
26 123 |
| 6 |
35 032 |
18 177 |
16 855 |
|
49 |
51 792 |
26 054 |
25 738 |
| 7 |
35 209 |
17 996 |
17 213 |
|
50 |
51 414 |
25 748 |
25 666 |
| 8 |
34 444 |
17 550 |
16 894 |
|
51 |
51 285 |
25 782 |
25 503 |
| 9 |
35 902 |
18 440 |
17 462 |
|
52 |
52 042 |
25 932 |
26 110 |
| 10 |
36 613 |
18 839 |
17 774 |
|
53 |
49 167 |
24 424 |
24 743 |
| 11 |
37 254 |
19 418 |
17 836 |
|
54 |
49 901 |
24 595 |
25 306 |
| 12 |
38 095 |
19 470 |
18 625 |
|
55 |
51 247 |
25 038 |
26 209 |
| 13 |
38 351 |
19 819 |
18 532 |
|
56 |
52 744 |
25 794 |
26 950 |
| 14 |
40 747 |
20 866 |
19 881 |
|
57 |
54 710 |
26 394 |
28 316 |
| 15 |
39 634 |
20 225 |
19 409 |
|
58 |
55 614 |
26 701 |
28 913 |
| 16 |
39 533 |
20 237 |
19 296 |
|
59 |
54 305 |
25 932 |
28 373 |
| 17 |
37 426 |
19 337 |
18 089 |
|
60 |
52 775 |
25 312 |
27 463 |
| 18 |
38 275 |
19 742 |
18 533 |
|
61 |
54 752 |
25 828 |
28 924 |
| 19 |
39 888 |
20 840 |
19 048 |
|
62 |
55 722 |
26 113 |
29 609 |
| 20 |
37 956 |
19 845 |
18 111 |
|
63 |
55 802 |
26 065 |
29 737 |
| 21 |
38 334 |
20 176 |
18 158 |
|
64 |
56 685 |
26 571 |
30 114 |
| 22 |
39 404 |
20 761 |
18 643 |
|
65 |
56 152 |
26 256 |
29 896 |
| 23 |
40 904 |
21 665 |
19 239 |
|
66 |
54 562 |
25 087 |
29 475 |
| 24 |
42 778 |
22 555 |
20 223 |
|
67 |
55 836 |
25 711 |
30 125 |
| 25 |
43 656 |
23 065 |
20 591 |
|
68 |
55 757 |
25 616 |
30 141 |
| 26 |
45 952 |
24 145 |
21 807 |
|
69 |
56 196 |
25 776 |
30 420 |
| 27 |
47 771 |
25 169 |
22 602 |
|
70 |
51 357 |
23 363 |
27 994 |
| 28 |
46 351 |
24 471 |
21 880 |
|
71 |
51 874 |
23 273 |
28 601 |
| 29 |
44 643 |
23 364 |
21 279 |
|
72 |
46 438 |
20 636 |
25 802 |
| 30 |
44 085 |
22 912 |
21 173 |
|
73 |
45 423 |
19 894 |
25 529 |
| 31 |
44 956 |
23 615 |
21 341 |
|
74 |
45 315 |
19 646 |
25 669 |
| 32 |
44 525 |
23 501 |
21 024 |
|
75 |
41 762 |
17 590 |
24 172 |
| 33 |
46 528 |
24 230 |
22 298 |
|
76 |
37 270 |
15 446 |
21 824 |
| 34 |
46 117 |
23 933 |
22 184 |
|
77 |
37 582 |
15 404 |
22 178 |
| 35 |
47 741 |
24 737 |
23 004 |
|
78 |
24 941 |
9 947 |
14 994 |
| 36 |
49 439 |
25 676 |
23 763 |
|
79 |
23 897 |
9 399 |
14 498 |
| 37 |
49 125 |
25 296 |
23 829 |
|
80 |
25 114 |
9 536 |
15 578 |
| 38 |
50 216 |
25 647 |
24 569 |
|
81 |
25 043 |
9 350 |
15 693 |
| 39 |
52 848 |
27 064 |
25 784 |
|
82 |
24 179 |
9 019 |
15 160 |
| 40 |
54 058 |
27 916 |
26 142 |
|
83 |
22 229 |
8 074 |
14 155 |
| 41 |
53 274 |
27 299 |
25 975 |
|
84 |
21 063 |
7 369 |
13 694 |
| 42 |
53 739 |
27 470 |
26 269 |
|
85 + |
94 693 |
29 364 |
65 329 |
|
4 POPULATION ESTIMATE, BY SEX AND AGE GROUPS, BY COUNTIES, MID-2024
|
| Age groups |
Republic of Croatia |
County of Zagreb |
County of Krapina-Zagorje |
County of Sisak-Moslavina |
| Total |
Men |
Women |
Total |
Men |
Women |
Total |
Men |
Women |
Total |
Men |
Women |
| Total |
3 866 233 |
1 882 564 |
1 983 669 |
307 815 |
151 800 |
156 015 |
119 204 |
58 565 |
60 639 |
134 663 |
66 435 |
68 228 |
| 0 – 4 |
171 071 |
87 739 |
83 332 |
14 100 |
7 191 |
6 909 |
5 089 |
2 574 |
2 515 |
5 497 |
2 870 |
2 627 |
| 5 – 9 |
175 836 |
90 070 |
85 766 |
14 401 |
7 271 |
7 130 |
5 273 |
2 726 |
2 547 |
5 592 |
2 840 |
2 752 |
| 10 – 14 |
191 060 |
98 412 |
92 648 |
15 950 |
8 237 |
7 713 |
5 715 |
2 946 |
2 769 |
6 246 |
3 169 |
3 077 |
| 15 – 19 |
194 756 |
100 381 |
94 375 |
16 389 |
8 447 |
7 942 |
5 950 |
3 055 |
2 895 |
6 634 |
3 354 |
3 280 |
| 20 – 24 |
199 376 |
105 002 |
94 374 |
16 456 |
8 814 |
7 642 |
6 433 |
3 382 |
3 051 |
6 885 |
3 649 |
3 236 |
| 25 – 29 |
228 373 |
120 214 |
108 159 |
18 565 |
9 992 |
8 573 |
7 213 |
3 814 |
3 399 |
7 530 |
4 178 |
3 352 |
| 30 – 34 |
226 211 |
118 191 |
108 020 |
18 457 |
9 892 |
8 565 |
7 016 |
3 709 |
3 307 |
6 634 |
3 668 |
2 966 |
| 35 – 39 |
249 369 |
128 420 |
120 949 |
20 262 |
10 675 |
9 587 |
7 692 |
4 022 |
3 670 |
7 516 |
3 997 |
3 519 |
| 40 – 44 |
270 033 |
138 211 |
131 822 |
22 330 |
11 707 |
10 623 |
8 131 |
4 252 |
3 879 |
8 612 |
4 560 |
4 052 |
| 45 – 49 |
265 300 |
133 939 |
131 361 |
22 337 |
11 524 |
10 813 |
8 074 |
4 143 |
3 931 |
8 871 |
4 613 |
4 258 |
| 50 – 54 |
253 809 |
126 481 |
127 328 |
20 550 |
10 410 |
10 140 |
8 354 |
4 263 |
4 091 |
9 090 |
4 682 |
4 408 |
| 55 – 59 |
268 620 |
129 859 |
138 761 |
20 639 |
10 082 |
10 557 |
9 221 |
4 539 |
4 682 |
10 108 |
5 075 |
5 033 |
| 60 – 64 |
275 736 |
129 889 |
145 847 |
20 484 |
9 646 |
10 838 |
9 148 |
4 531 |
4 617 |
10 704 |
5 152 |
5 552 |
| 65 – 69 |
278 503 |
128 446 |
150 057 |
21 119 |
9 565 |
11 554 |
8 473 |
4 006 |
4 467 |
11 006 |
5 204 |
5 802 |
| 70 – 74 |
240 407 |
106 812 |
133 595 |
18 359 |
8 093 |
10 266 |
6 806 |
3 031 |
3 775 |
9 590 |
4 219 |
5 371 |
| 75 – 79 |
165 452 |
67 786 |
97 666 |
12 465 |
5 099 |
7 366 |
4 619 |
1 858 |
2 761 |
6 287 |
2 596 |
3 691 |
| 80 – 84 |
117 628 |
43 348 |
74 280 |
8 433 |
3 222 |
5 211 |
3 369 |
1 109 |
2 260 |
4 478 |
1 596 |
2 882 |
| 85 + |
94 693 |
29 364 |
65 329 |
6 519 |
1 933 |
4 586 |
2 628 |
605 |
2 023 |
3 383 |
1 013 |
2 370 |
|
4 POPULATION ESTIMATE, BY SEX AND AGE GROUPS, BY COUNTIES, MID-2024
|
|
|
|
|
|
|
|
|
|
|
| Age groups |
County of Karlovac |
County of Varaždin |
County of Koprivnica-Križevci |
| Total |
Men |
Women |
Total |
Men |
Women |
Total |
Men |
Women |
| Total |
109 823 |
53 791 |
56 032 |
158 818 |
78 561 |
80 257 |
99 229 |
48 857 |
50 372 |
| 0 – 4 |
4 240 |
2 163 |
2 077 |
6 421 |
3 262 |
3 159 |
4 504 |
2 338 |
2 166 |
| 5 – 9 |
4 601 |
2 335 |
2 266 |
6 867 |
3 463 |
3 404 |
4 671 |
2 385 |
2 286 |
| 10 – 14 |
5 025 |
2 531 |
2 494 |
7 763 |
3 945 |
3 818 |
4 959 |
2 565 |
2 394 |
| 15 – 19 |
5 309 |
2 709 |
2 600 |
8 406 |
4 366 |
4 040 |
5 337 |
2 859 |
2 478 |
| 20 – 24 |
5 332 |
2 863 |
2 469 |
8 660 |
4 561 |
4 099 |
5 319 |
2 790 |
2 529 |
| 25 – 29 |
5 653 |
3 022 |
2 631 |
9 668 |
5 235 |
4 433 |
5 638 |
3 046 |
2 592 |
| 30 – 34 |
5 653 |
2 996 |
2 657 |
9 168 |
5 053 |
4 115 |
5 335 |
2 883 |
2 452 |
| 35 – 39 |
6 697 |
3 545 |
3 152 |
10 658 |
5 708 |
4 950 |
5 974 |
3 128 |
2 846 |
| 40 – 44 |
7 556 |
3 964 |
3 592 |
11 549 |
6 089 |
5 460 |
6 612 |
3 455 |
3 157 |
| 45 – 49 |
7 516 |
3 860 |
3 656 |
11 137 |
5 818 |
5 319 |
6 545 |
3 392 |
3 153 |
| 50 – 54 |
7 274 |
3 759 |
3 515 |
10 895 |
5 544 |
5 351 |
6 646 |
3 294 |
3 352 |
| 55 – 59 |
8 148 |
4 023 |
4 125 |
11 629 |
5 739 |
5 890 |
7 405 |
3 604 |
3 801 |
| 60 – 64 |
8 843 |
4 167 |
4 676 |
11 732 |
5 627 |
6 105 |
7 637 |
3 676 |
3 961 |
| 65 – 69 |
9 072 |
4 336 |
4 736 |
11 142 |
5 231 |
5 911 |
7 442 |
3 570 |
3 872 |
| 70 – 74 |
7 304 |
3 351 |
3 953 |
8 878 |
3 926 |
4 952 |
6 118 |
2 705 |
3 413 |
| 75 – 79 |
4 771 |
1 988 |
2 783 |
6 258 |
2 547 |
3 711 |
4 119 |
1 644 |
2 475 |
| 80 – 84 |
3 556 |
1 216 |
2 340 |
4 643 |
1 601 |
3 042 |
2 916 |
986 |
1 930 |
| 85 + |
3 273 |
963 |
2 310 |
3 344 |
846 |
2 498 |
2 052 |
537 |
1 515 |
|
4 POPULATION ESTIMATE, BY SEX AND AGE GROUPS, BY COUNTIES, MID-2024
|
|
|
|
|
|
|
|
|
|
|
| Age groups |
County of Bjelovar-Bilogora |
County of Primorje-Gorski kotar |
County of Lika-Senj |
| Total |
Men |
Women |
Total |
Men |
Women |
Total |
Men |
Women |
| Total |
98 596 |
48 342 |
50 254 |
265 223 |
127 857 |
137 366 |
43 058 |
21 430 |
21 628 |
| 0 – 4 |
4 579 |
2 312 |
2 267 |
9 736 |
4 926 |
4 810 |
1 772 |
920 |
852 |
| 5 – 9 |
4 502 |
2 306 |
2 196 |
10 645 |
5 519 |
5 126 |
1 886 |
974 |
912 |
| 10 – 14 |
4 935 |
2 660 |
2 275 |
11 739 |
6 009 |
5 730 |
1 945 |
989 |
956 |
| 15 – 19 |
5 178 |
2 654 |
2 524 |
11 527 |
5 981 |
5 546 |
2 060 |
1 084 |
976 |
| 20 – 24 |
5 053 |
2 650 |
2 403 |
11 796 |
6 132 |
5 664 |
2 087 |
1 110 |
977 |
| 25 – 29 |
5 621 |
3 034 |
2 587 |
13 568 |
7 119 |
6 449 |
2 443 |
1 300 |
1 143 |
| 30 – 34 |
5 054 |
2 713 |
2 341 |
14 539 |
7 445 |
7 094 |
2 315 |
1 174 |
1 141 |
| 35 – 39 |
5 623 |
2 939 |
2 684 |
17 061 |
8 644 |
8 417 |
2 553 |
1 330 |
1 223 |
| 40 – 44 |
6 118 |
3 205 |
2 913 |
19 468 |
9 937 |
9 531 |
2 662 |
1 343 |
1 319 |
| 45 – 49 |
6 382 |
3 276 |
3 106 |
19 490 |
9 902 |
9 588 |
2 737 |
1 391 |
1 346 |
| 50 – 54 |
6 386 |
3 228 |
3 158 |
17 638 |
8 726 |
8 912 |
2 883 |
1 514 |
1 369 |
| 55 – 59 |
7 137 |
3 496 |
3 641 |
17 969 |
8 420 |
9 549 |
3 210 |
1 662 |
1 548 |
| 60 – 64 |
7 696 |
3 678 |
4 018 |
19 594 |
9 069 |
10 525 |
3 389 |
1 717 |
1 672 |
| 65 – 69 |
8 021 |
3 765 |
4 256 |
20 763 |
9 487 |
11 276 |
3 386 |
1 695 |
1 691 |
| 70 – 74 |
6 648 |
3 003 |
3 645 |
19 862 |
8 864 |
10 998 |
2 814 |
1 345 |
1 469 |
| 75 – 79 |
4 285 |
1 742 |
2 543 |
13 185 |
5 601 |
7 584 |
1 888 |
788 |
1 100 |
| 80 – 84 |
3 024 |
1 022 |
2 002 |
8 911 |
3 458 |
5 453 |
1 596 |
619 |
977 |
| 85 + |
2 354 |
659 |
1 695 |
7 732 |
2 618 |
5 114 |
1 432 |
475 |
957 |
|
4 POPULATION ESTIMATE, BY SEX AND AGE GROUPS, BY COUNTIES, MID-2024
|
|
|
|
|
|
|
|
|
|
|
| Age groups |
County of Virovitica-Podravina |
County of Požega-Slavonia |
County of Slavonski Brod-Posavina |
| Total |
Men |
Women |
Total |
Men |
Women |
Total |
Men |
Women |
| Total |
67 554 |
32 868 |
34 686 |
60 976 |
29 744 |
31 232 |
126 444 |
62 711 |
63 733 |
| 0 – 4 |
2 913 |
1 478 |
1 435 |
2 736 |
1 379 |
1 357 |
5 610 |
2 858 |
2 752 |
| 5 – 9 |
2 961 |
1 532 |
1 429 |
2 756 |
1 425 |
1 331 |
5 585 |
2 889 |
2 696 |
| 10 – 14 |
3 475 |
1 804 |
1 671 |
3 072 |
1 600 |
1 472 |
6 304 |
3 278 |
3 026 |
| 15 – 19 |
3 659 |
1 889 |
1 770 |
3 504 |
1 823 |
1 681 |
7 033 |
3 714 |
3 319 |
| 20 – 24 |
3 532 |
1 837 |
1 695 |
3 392 |
1 744 |
1 648 |
7 333 |
3 951 |
3 382 |
| 25 – 29 |
3 818 |
2 041 |
1 777 |
3 539 |
1 912 |
1 627 |
7 462 |
4 153 |
3 309 |
| 30 – 34 |
3 465 |
1 865 |
1 600 |
2 978 |
1 558 |
1 420 |
6 442 |
3 527 |
2 915 |
| 35 – 39 |
3 905 |
1 994 |
1 911 |
3 304 |
1 673 |
1 631 |
7 280 |
3 854 |
3 426 |
| 40 – 44 |
4 418 |
2 300 |
2 118 |
3 706 |
1 888 |
1 818 |
7 636 |
4 063 |
3 573 |
| 45 – 49 |
4 272 |
2 105 |
2 167 |
3 823 |
1 876 |
1 947 |
7 706 |
3 934 |
3 772 |
| 50 – 54 |
4 297 |
2 097 |
2 200 |
3 967 |
2 039 |
1 928 |
8 151 |
4 205 |
3 946 |
| 55 – 59 |
5 293 |
2 604 |
2 689 |
4 547 |
2 246 |
2 301 |
9 433 |
4 657 |
4 776 |
| 60 – 64 |
5 666 |
2 707 |
2 959 |
4 809 |
2 341 |
2 468 |
10 217 |
4 910 |
5 307 |
| 65 – 69 |
5 482 |
2 560 |
2 922 |
4 873 |
2 319 |
2 554 |
9 913 |
4 710 |
5 203 |
| 70 – 74 |
4 249 |
1 914 |
2 335 |
3 948 |
1 798 |
2 150 |
7 961 |
3 626 |
4 335 |
| 75 – 79 |
2 733 |
1 079 |
1 654 |
2 601 |
1 039 |
1 562 |
5 358 |
2 125 |
3 233 |
| 80 – 84 |
2 015 |
676 |
1 339 |
1 975 |
660 |
1 315 |
3 973 |
1 396 |
2 577 |
| 85 + |
1 401 |
386 |
1 015 |
1 446 |
424 |
1 022 |
3 047 |
861 |
2 186 |
|
4 POPULATION ESTIMATE, BY SEX AND AGE GROUPS, BY COUNTIES, MID-2024
|
|
|
|
|
|
|
|
|
|
|
| Age groups |
County of Zadar |
County of Osijek-Baranja |
County of Šibenik-Knin |
| Total |
Men |
Women |
Total |
Men |
Women |
Total |
Men |
Women |
| Total |
164 323 |
81 009 |
83 314 |
250 767 |
121 366 |
129 401 |
95 622 |
47 332 |
48 290 |
| 0 – 4 |
7 560 |
3 840 |
3 720 |
10 911 |
5 651 |
5 260 |
3 940 |
1 994 |
1 946 |
| 5 – 9 |
7 629 |
3 971 |
3 658 |
11 007 |
5 655 |
5 352 |
3 847 |
1 970 |
1 877 |
| 10 – 14 |
8 250 |
4 260 |
3 990 |
12 232 |
6 190 |
6 042 |
4 342 |
2 205 |
2 137 |
| 15 – 19 |
8 453 |
4 366 |
4 087 |
12 679 |
6 485 |
6 194 |
4 402 |
2 261 |
2 141 |
| 20 – 24 |
8 619 |
4 462 |
4 157 |
13 365 |
6 887 |
6 478 |
4 651 |
2 473 |
2 178 |
| 25 – 29 |
9 965 |
5 173 |
4 792 |
14 746 |
7 776 |
6 970 |
5 182 |
2 734 |
2 448 |
| 30 – 34 |
9 440 |
4 878 |
4 562 |
13 880 |
7 321 |
6 559 |
4 813 |
2 519 |
2 294 |
| 35 – 39 |
10 012 |
5 157 |
4 855 |
15 438 |
8 040 |
7 398 |
5 373 |
2 755 |
2 618 |
| 40 – 44 |
10 852 |
5 389 |
5 463 |
16 432 |
8 352 |
8 080 |
5 876 |
3 041 |
2 835 |
| 45 – 49 |
11 026 |
5 506 |
5 520 |
16 115 |
8 020 |
8 095 |
5 959 |
3 104 |
2 855 |
| 50 – 54 |
10 385 |
5 063 |
5 322 |
16 103 |
7 912 |
8 191 |
6 004 |
3 063 |
2 941 |
| 55 – 59 |
11 056 |
5 448 |
5 608 |
19 050 |
9 180 |
9 870 |
6 727 |
3 300 |
3 427 |
| 60 – 64 |
10 953 |
5 288 |
5 665 |
20 072 |
9 465 |
10 607 |
7 293 |
3 538 |
3 755 |
| 65 – 69 |
11 767 |
5 716 |
6 051 |
19 922 |
9 245 |
10 677 |
7 829 |
3 869 |
3 960 |
| 70 – 74 |
10 847 |
5 171 |
5 676 |
15 717 |
7 029 |
8 688 |
7 229 |
3 451 |
3 778 |
| 75 – 79 |
8 039 |
3 661 |
4 378 |
10 378 |
4 048 |
6 330 |
5 204 |
2 408 |
2 796 |
| 80 – 84 |
5 273 |
2 200 |
3 073 |
7 437 |
2 639 |
4 798 |
3 622 |
1 485 |
2 137 |
| 85 + |
4 197 |
1 460 |
2 737 |
5 283 |
1 471 |
3 812 |
3 329 |
1 162 |
2 167 |
|
4 POPULATION ESTIMATE, BY SEX AND AGE GROUPS, BY COUNTIES, MID-2024
|
|
|
|
|
|
|
|
|
|
|
| Age groups |
County of Vukovar-Srijem |
County of Split-Dalmatia |
County of Istria |
| Total |
Men |
Women |
Total |
Men |
Women |
Total |
Men |
Women |
| Total |
137 509 |
67 027 |
70 482 |
428 680 |
208 876 |
219 804 |
202 844 |
99 296 |
103 548 |
| 0 – 4 |
6 004 |
3 207 |
2 797 |
19 648 |
10 162 |
9 486 |
7 901 |
4 023 |
3 878 |
| 5 – 9 |
6 072 |
3 092 |
2 980 |
20 033 |
10 309 |
9 724 |
8 396 |
4 290 |
4 106 |
| 10 – 14 |
6 848 |
3 528 |
3 320 |
21 960 |
11 353 |
10 607 |
9 241 |
4 803 |
4 438 |
| 15 – 19 |
7 749 |
3 962 |
3 787 |
22 862 |
11 639 |
11 223 |
9 290 |
4 901 |
4 389 |
| 20 – 24 |
7 841 |
4 132 |
3 709 |
23 763 |
12 279 |
11 484 |
9 257 |
5 036 |
4 221 |
| 25 – 29 |
7 748 |
4 128 |
3 620 |
26 417 |
13 465 |
12 952 |
10 531 |
5 540 |
4 991 |
| 30 – 34 |
6 682 |
3 576 |
3 106 |
26 097 |
13 471 |
12 626 |
11 519 |
5 938 |
5 581 |
| 35 – 39 |
7 827 |
4 070 |
3 757 |
27 472 |
13 857 |
13 615 |
13 845 |
7 156 |
6 689 |
| 40 – 44 |
8 294 |
4 240 |
4 054 |
28 645 |
14 470 |
14 175 |
15 173 |
7 779 |
7 394 |
| 45 – 49 |
8 524 |
4 315 |
4 209 |
28 710 |
14 364 |
14 346 |
14 671 |
7 510 |
7 161 |
| 50 – 54 |
8 941 |
4 577 |
4 364 |
27 945 |
13 904 |
14 041 |
13 141 |
6 573 |
6 568 |
| 55 – 59 |
10 379 |
5 073 |
5 306 |
28 706 |
13 939 |
14 767 |
14 289 |
6 741 |
7 548 |
| 60 – 64 |
11 080 |
5 360 |
5 720 |
29 422 |
13 969 |
15 453 |
15 501 |
7 308 |
8 193 |
| 65 – 69 |
10 933 |
5 069 |
5 864 |
29 821 |
13 852 |
15 969 |
15 477 |
7 206 |
8 271 |
| 70 – 74 |
9 010 |
3 890 |
5 120 |
25 831 |
11 659 |
14 172 |
13 675 |
6 293 |
7 382 |
| 75 – 79 |
6 094 |
2 394 |
3 700 |
18 923 |
8 037 |
10 886 |
8 760 |
3 860 |
4 900 |
| 80 – 84 |
4 252 |
1 490 |
2 762 |
11 774 |
4 545 |
7 229 |
6 483 |
2 528 |
3 955 |
| 85 + |
3 231 |
924 |
2 307 |
10 651 |
3 602 |
7 049 |
5 694 |
1 811 |
3 883 |
|
4 POPULATION ESTIMATE, BY SEX AND AGE GROUPS, BY COUNTIES, MID-2024
|
|
|
|
|
|
|
|
|
|
|
| Age groups |
County of Dubrovnik-Neretva |
County of Međimurje |
City of Zagreb |
| Total |
Men |
Women |
Total |
Men |
Women |
Total |
Men |
Women |
| Total |
115 912 |
56 982 |
58 930 |
104 948 |
51 854 |
53 094 |
774 225 |
367 861 |
406 364 |
| 0 – 4 |
5 453 |
2 816 |
2 637 |
5 293 |
2 736 |
2 557 |
37 164 |
19 039 |
18 125 |
| 5 – 9 |
5 749 |
2 886 |
2 863 |
5 595 |
2 878 |
2 717 |
37 768 |
19 354 |
18 414 |
| 10 – 14 |
6 041 |
3 047 |
2 994 |
5 727 |
3 006 |
2 721 |
39 291 |
20 287 |
19 004 |
| 15 – 19 |
5 851 |
3 041 |
2 810 |
5 711 |
2 909 |
2 802 |
36 773 |
18 882 |
17 891 |
| 20 – 24 |
5 846 |
3 081 |
2 765 |
5 830 |
3 164 |
2 666 |
37 926 |
20 005 |
17 921 |
| 25 – 29 |
6 958 |
3 697 |
3 261 |
6 023 |
3 210 |
2 813 |
50 085 |
25 645 |
24 440 |
| 30 – 34 |
6 951 |
3 626 |
3 325 |
5 905 |
3 142 |
2 763 |
53 868 |
27 237 |
26 631 |
| 35 – 39 |
7 512 |
3 843 |
3 669 |
6 831 |
3 574 |
3 257 |
56 534 |
28 459 |
28 075 |
| 40 – 44 |
7 819 |
4 027 |
3 792 |
7 285 |
3 756 |
3 529 |
60 859 |
30 394 |
30 465 |
| 45 – 49 |
7 766 |
4 032 |
3 734 |
6 956 |
3 600 |
3 356 |
56 683 |
27 654 |
29 029 |
| 50 – 54 |
7 267 |
3 640 |
3 627 |
6 451 |
3 185 |
3 266 |
51 441 |
24 803 |
26 638 |
| 55 – 59 |
7 712 |
3 749 |
3 963 |
7 118 |
3 463 |
3 655 |
48 844 |
22 819 |
26 025 |
| 60 – 64 |
7 803 |
3 659 |
4 144 |
7 429 |
3 554 |
3 875 |
46 264 |
20 527 |
25 737 |
| 65 – 69 |
7 941 |
3 733 |
4 208 |
7 415 |
3 509 |
3 906 |
46 706 |
19 799 |
26 907 |
| 70 – 74 |
7 275 |
3 314 |
3 961 |
6 297 |
2 980 |
3 317 |
41 989 |
17 150 |
24 839 |
| 75 – 79 |
5 176 |
2 243 |
2 933 |
3 916 |
1 635 |
2 281 |
30 393 |
11 394 |
18 999 |
| 80 – 84 |
3 473 |
1 444 |
2 029 |
2 955 |
1 038 |
1 917 |
23 470 |
8 418 |
15 052 |
| 85 + |
3 319 |
1 104 |
2 215 |
2 211 |
515 |
1 696 |
18 167 |
5 995 |
12 172 |
|
NOTES ON METHODOLOGY
Data sources
The following surveys are the data sources for the population estimate of the Republic of Croatia:
- 2011 Census of Population, Households and Dwellings
- 2021 Census of Population, Households and Dwellings
- birth statistics
- death statistics
- statistics of the internal migration of population
- statistics of the international migration of population.
The data on births are collected through the Statistical Report on Births (DEM-1) for every entry in the State birth register.
The data on deaths are collected through the Statistical Report on Deaths (DEM-2) for every entry in the State death register.
The surveys on the internal and international migration of population are based on data collected by the Ministry of the Interior.
Coverage
The mid-2020 population estimate data encompasses all persons included in the total population of the Republic of Croatia in the 2011 Census of Population, Households and Dwellings, all who were born and entered into the State birth register in the period from 1 April 2011 to the estimate date, all persons who died and were entered into the State death register in the period from 1 April 2011 to the estimate date and all persons who immigrated from abroad or emigrated abroad, as well as persons who migrated inside the territory of the Republic of Croatia in the period from 1 April 2011 to the estimate date, and the data were revised on the basis of the 2021 Census.
The mid-2021 population estimate data encompasses all persons included in the total population of the Republic of Croatia in the 2021 Census of Population, Households and Dwellings, all who were born and entered into the State birth register in the period from the estimate date to 31 August 2021, all persons who died and were entered into the State death register in the period from the estimate date to 31 August 2021 and all persons who immigrated from abroad or emigrated abroad, as well as persons who migrated inside the territory of the Republic of Croatia in the period from the estimate date to 31 August 2021.
The mid-2022, mid-2023 and mid-2024 population estimates data encompasses all persons included in the total population of the Republic of Croatia in the 2021 Census of Population, Households and Dwellings, all who were born and entered into the State birth register in the period from 1 September 2021 to the estimate date, all persons who died and were entered into the State death register in the period from 1 September 2021 to the estimate date and all persons who immigrated from abroad or emigrated abroad, as well as persons who migrated inside the territory of the Republic of Croatia in the period from 1 September 2021 to the estimate date.
Definitions and explanations
Mid-2020 population estimate was revised on the basis of the 2011 Census and the 2021 Census, natural change and net migration data.
Mid-2021, mid-2022, mid-2023 and mid-2024 population estimates were calculated on the basis of the 2021 Census, natural change and net migration data.
In the 2011 Census and 2021 Census, according to the international statistical standards, the concept of the place of usual residence is used in defining the total population. The place of usual residence is considered a place where a person spends most of his/her daily period of rest, irrespective of a short-term absence from it (e.g. due to going on a vacation, trip, medical treatment, visit etc.). In line with the definition of the place of usual residence, the total population includes the following persons:
- those who have lived in their place of usual residence for a continuous period of at least 12 months before the Census reference time
- those who arrived in their place of usual residence during the 12 months before the Census reference time with the intention of staying there for at least one year.
A live born child (live birth) is every child who at birth exhibits signs of life, such as breathing, beating of the heart, pulsation of the umbilical cord or definite movements of voluntary muscles.
A deceased person (death) is every live born person in whom there is a permanent disappearance of all evidence of life.
Natural increase is the difference between the number of live births and the number of deaths.
Data by age are expressed by completed years of age on the referent date. The data by age groups include persons who reached the age within the limits of an interval.
Average age indicates the mean age of the total population, and it is calculated as the arithmetic mean of the age of the total population.
Ageing index represents the ratio of the population, that is, the share (%) of inhabitants aged 60 and over in the number of inhabitants aged from 0 to 19 inclusive.
Fertile female population includes women between 15 and 49 years of age.
Place of permanent residence, according to Article 2 of the Permanent Residence Act (NN, Nos 144/12, 158/13 and 114/22) is "a place and address in the Republic of Croatia where a person settled with an intention of staying permanently in order to exercise their rights and commitments related to life interests such as family, professional, economic, social, cultural and other interests".
Immigrated or emigrated population is the population that changed their place of usual residence on the territory of the Republic of Croatia or that changed their country of usual residence for a period that is, or is expected to be, of at least one year.
Net migration of population (migration balance) is the difference between the number of immigrants and the number of emigrants of a particular area or country in a given period of time.
Territorial constitution
The data are presented by territorial constitution according to the Act on Territories of Counties, Towns and Municipalities in the Republic of Croatia (NN, Nos 86/06, 125/06, 16/07, 95/08, 46/10, 145/10, 37/13, 44/13, 45/13 and 110/15), with the situation as on 31 December 2024.
|
Abbreviations
|
|
| NN |
Narodne novine, official gazette of the Republic of Croatia |
| '000 |
thousand |
Published by the Croatian Bureau of Statistics, Zagreb, Ilica 3, P. O. B. 80.
Phone: (+385 1) 48 06 111
Press corner: press@dzs.hr
Persons responsible:
Mario Vlajčević, Director of Demographic and Social Statistics Directorate
Lidija Brković, Director General
Prepared by:
Tatjana Radić and Andrea Zebec
USERS ARE KINDLY REQUESTED TO STATE THE SOURCE.
Customer Relations and Data Protection Department
Information and user requests
Phone: (+385 1) 48 06 138, 48 06 154, 48 06 115
E-mail: stat.info@dzs.hr
Subscription
Phone: (+385 1) 21 00 455
E-mail: prodaja@dzs.hr

