
First Release
LABOUR FORCE IN THE REPUBLIC OF CROATIA, 2023 – ANNUAL AVERAGE
The Labour Force Survey (LFS) results are presented for the annual period from January to December 2023.
According to the Labour Force Survey, there were 1 603 thousand employed persons and 104 thousand unemployed persons in the Republic of Croatia in 2023.
In the same reference period, the employment rate for persons aged 15 to 64 was 65.7%, while the ILO unemployment rate for the same age group was 6.2%.
The data for 2023 were estimated on the basis of the results of the 2021 Census of Population, Households and Dwellings in the Republic of Croatia (the 2021 Census), whereas the data published previously were estimated on the basis of the 2011 Census. This has caused a break in time series, therefore the data for 2023 are not comparable with the data for previous years. The data will be subsequently revised in order to ensure consistency and comparability of the data for 2023 with the already published data for previous years. In this way, the data for previous years will be harmonised with the results of the 2021 Census using the calibration method.
Having in mind that the Labour Force Survey methodology is harmonised with the methodology prescribed by the Statistical Office of the European Union (Eurostat), the results for the Republic of Croatia are comparable with the results of all EU Member States. A continuous application of the methodological concept, as prescribed by Eurostat and the International Labour Organisation, ensured that the Labour Force Survey results on an annual basis clearly point to the labour market trends of the Republic of Croatia.
More detailed results of the Labour Force Survey can be downloaded from Eurostat’s website https://ec.europa.eu/eurostat/ web/main/data/database.
Data presented for the period from 2019 to 2023 are averages of four quarterly results.
G-1 CHANGES IN CATEGORIES OF WORKING-AGE POPULATION, 2019 ‒ 2023
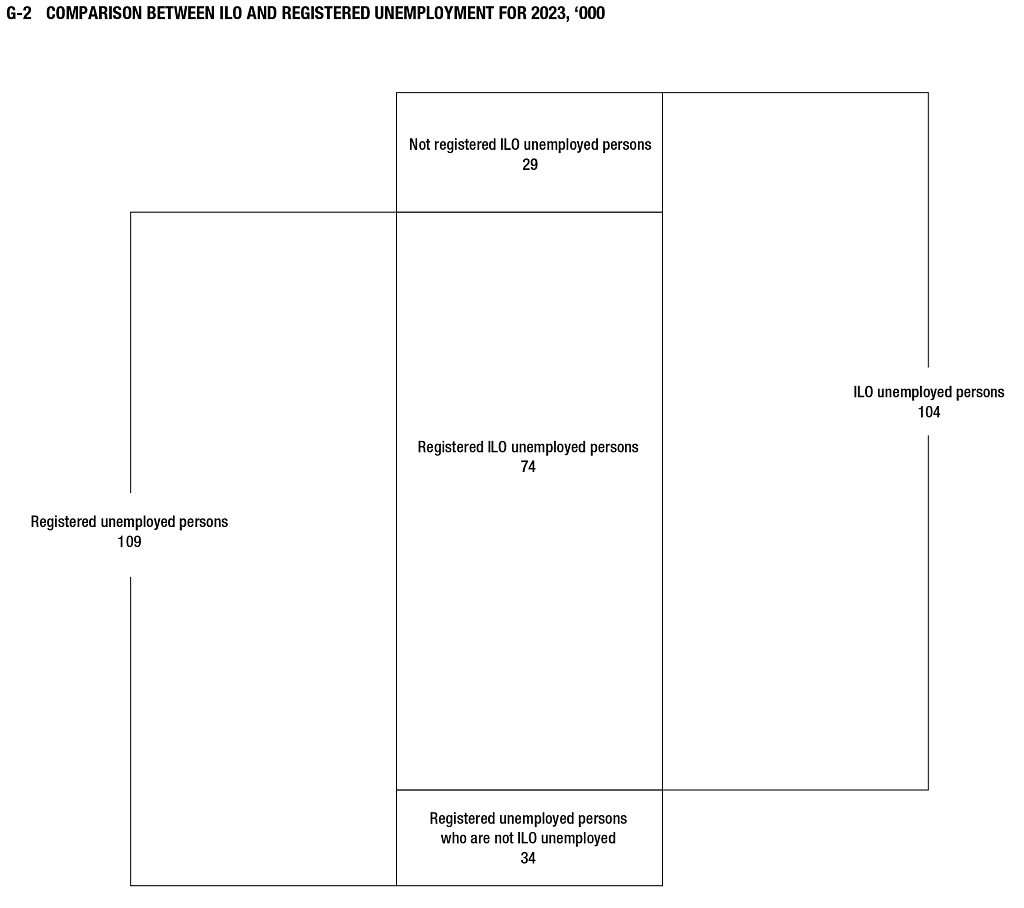
The comparison of unemployment data obtained by the Labour Force Survey with those according to the Croatian Employment Service (CES) and those obtained from other administrative data records shows that the average unemployment rate in 2023, according to the administrative records, was equal to the ILO unemployment rate (6.1%). In the same period, the average number of unemployed persons according to the Labour Force Survey was five thousand persons lower than the number obtained from the CES. Since interviewed persons provided information on their registration with the CES, the data comparison shows that 74 thousand, or 71.7%, out of the total of 104 thousand unemployed persons were registered with the CES, 28.2% of persons who were classified as unemployed in the Labour Force Survey were not interested in registering with the CES, while the remaining 0.1% did not answer the question regarding their registration with the CES. At the same time, 34 thousand, or 31.6%, of the total of 109 thousand persons who were registered with the CES did not fulfil the international criteria of unemployment.
1 WORKING-AGE POPULATION, BY ACTIVITY AND SEX1) |
|||||||||||||||||||||||||||||||||||||||||||||||||||||||||||||||||||||||||||||||||||||||||||||||||||||||||||||||||||||||||||||||||||||||||||||||||||||||||||
|
‘000
1) The sum total may not equal the sum of individual categories due to the rounding. |
|||||||||||||||||||||||||||||||||||||||||||||||||||||||||||||||||||||||||||||||||||||||||||||||||||||||||||||||||||||||||||||||||||||||||||||||||||||||||||
2 WORKING-AGE POPULATION, BY ACTIVITY, AGE AND SEX |
|||||||||||||||||||||||||||||||||||||||||||||||||||||||||||||||||||||||||||||||||||||||||||||||||||||||||||||||||||||||||||||||||||||||||||||||||||||||||||||||||||||||||||||||||||||||||||||||||||||||||||||||||||||||||||||||||||||||||||||||||||||||||||||||||||||||||||||||||||||||||||||||||||||||||||||||||||||||||||||||||||||||||||||||||||||||||||||||||||||||||||||||||||||||||||||||||||||||||||||||||||||||||||||||||||||||||||||||||||||||||||||||||||||||||||||||||||||||||||||||||||||||||||||||||||||||||||||||||||||||||||||||||||||||||||||||||||||||||||||||||||||||||||||||||||||||||||||||||||||||||||||||||||||||||||||||||||||||||||||||||||||||||||||||||||||||||||||||||||||||||||||||||||||||||||||||||||||||||||||||||||||||||||||||||||||||||||||||||||||||||||||||||||||||||||||||||||||||||||||||||||||||||||||||||||||||||||||||||||||||||||||||||||||||||||||||||||||||||||||||||||||||||||||||||||||||||||||||||||||||||||||||||||||||||||||||||||||||||||||||||||||||||||||||||||||||||||||||||||||||
|
‘000
1) A break in time series (more details in the introductory part of the First Release). |
|||||||||||||||||||||||||||||||||||||||||||||||||||||||||||||||||||||||||||||||||||||||||||||||||||||||||||||||||||||||||||||||||||||||||||||||||||||||||||||||||||||||||||||||||||||||||||||||||||||||||||||||||||||||||||||||||||||||||||||||||||||||||||||||||||||||||||||||||||||||||||||||||||||||||||||||||||||||||||||||||||||||||||||||||||||||||||||||||||||||||||||||||||||||||||||||||||||||||||||||||||||||||||||||||||||||||||||||||||||||||||||||||||||||||||||||||||||||||||||||||||||||||||||||||||||||||||||||||||||||||||||||||||||||||||||||||||||||||||||||||||||||||||||||||||||||||||||||||||||||||||||||||||||||||||||||||||||||||||||||||||||||||||||||||||||||||||||||||||||||||||||||||||||||||||||||||||||||||||||||||||||||||||||||||||||||||||||||||||||||||||||||||||||||||||||||||||||||||||||||||||||||||||||||||||||||||||||||||||||||||||||||||||||||||||||||||||||||||||||||||||||||||||||||||||||||||||||||||||||||||||||||||||||||||||||||||||||||||||||||||||||||||||||||||||||||||||||||||||||||
3 POPULATION ACTIVITY MEASURES, BY AGE AND SEX |
||||||||||||||||||||||||||||||||||||||||||||||||||||||||||||||||||||||||||||||||||||||||||||||||||||||||||||||||||||||||||||||||||||||||||||||||||||||||||||||||||||||||||||||||||||||||||||||||||||||||||||||||||||||||||||||||||||||||||||||||||||||||||||||||||||||||||||||||||||||||||||||||||||||||||||||||||||||||||||||||||||||||||||||||||||||||||||||||||||||||||||||||||||||||||||||||||||||||||||||||||||||||||||||||||||||||||||||||||||||||||||||||||||||||||||||||||||||||||||||||||||||||||||||||||||||||||||||||||||||||||||||||||||||||||||||||||||||||||||||||||||||||||||||||||||||||||||||||||||||||||||||||||||||||||||||||||||||||||||||||||||||||||||||||||||||||||||||||||||||||||||||||||||||||||||||||||||||||||||||||||||||||||||||||||||||||||||||||||||||||||||||||||||||||||||||||||||||||||||||||||||||||||||||||||||||||||||||||||||||||||||||||||||||||||||||||||||||||||
|
%
1) A break in time series (more details in the introductory part of the First Release). |
||||||||||||||||||||||||||||||||||||||||||||||||||||||||||||||||||||||||||||||||||||||||||||||||||||||||||||||||||||||||||||||||||||||||||||||||||||||||||||||||||||||||||||||||||||||||||||||||||||||||||||||||||||||||||||||||||||||||||||||||||||||||||||||||||||||||||||||||||||||||||||||||||||||||||||||||||||||||||||||||||||||||||||||||||||||||||||||||||||||||||||||||||||||||||||||||||||||||||||||||||||||||||||||||||||||||||||||||||||||||||||||||||||||||||||||||||||||||||||||||||||||||||||||||||||||||||||||||||||||||||||||||||||||||||||||||||||||||||||||||||||||||||||||||||||||||||||||||||||||||||||||||||||||||||||||||||||||||||||||||||||||||||||||||||||||||||||||||||||||||||||||||||||||||||||||||||||||||||||||||||||||||||||||||||||||||||||||||||||||||||||||||||||||||||||||||||||||||||||||||||||||||||||||||||||||||||||||||||||||||||||||||||||||||||||||||||||||||||
4 SHARE IN WORKING-AGE POPULATION, BY EDUCATIONAL ATTAINMENT AND SEX |
|||||||||||||||||||||||||||||||||||||||||||||||||||||||||||||||||||||||||||||||||||||||||||||||||||||||||||||||||||||||||||||||||||||||||||||||||||||||||||||||||||||||||||||||||||||||||||||||||||||||||||||||||||||||||||||||||||||||||||||||||||||||||||||||||||||||||||||||||||||||||||||||||||||||||||||||||||||||||||||||||||||||||||||||||||||||||||||||||||||||||||||||||||||||||||||||||||||||||||||||||||||||||||||||
|
%
1) A break in time series (more details in the introductory part of the First Release). |
|||||||||||||||||||||||||||||||||||||||||||||||||||||||||||||||||||||||||||||||||||||||||||||||||||||||||||||||||||||||||||||||||||||||||||||||||||||||||||||||||||||||||||||||||||||||||||||||||||||||||||||||||||||||||||||||||||||||||||||||||||||||||||||||||||||||||||||||||||||||||||||||||||||||||||||||||||||||||||||||||||||||||||||||||||||||||||||||||||||||||||||||||||||||||||||||||||||||||||||||||||||||||||||||
5 EMPLOYED PERSONS, BY STATUS IN EMPLOYMENT AND SEX |
|||||||||||||||||||||||||||||||||||||||||||||||||||||||||||||||||||||||||||||||||||||||||||||||||||||||||||||||||||||||||||||||||||||||||||||||||||||||||||||||||||||||||||||||||||||||||||||||||||||||||||||||||||||||||||||||||||||||||||||||||||||||||||||||||||||||||||||||||||||||||||||||||||||||||||
|
‘000
1) A break in time series (more details in the introductory part of the First Release). |
|||||||||||||||||||||||||||||||||||||||||||||||||||||||||||||||||||||||||||||||||||||||||||||||||||||||||||||||||||||||||||||||||||||||||||||||||||||||||||||||||||||||||||||||||||||||||||||||||||||||||||||||||||||||||||||||||||||||||||||||||||||||||||||||||||||||||||||||||||||||||||||||||||||||||||
6 EMPLOYED PERSONS, ACCORDING TO NKD 2007 SECTIONS AND BY SEX |
||||||||||||||||||||||||||||||||||||||||||||||||||||||||||||||||||||||||||||||||||||||||||||||||||||||||||||||||||||||||||||||||||||||||||||||||||||||||||||||||||||||||||||||||||||||||||||||||||||||||||||||||||||||||||||||||||||||||||||||||||||||||||||||||||||||||||||||||||||||||||||||||||||||||||||||||||||||||||||||||||||||||||||||||||||||||||||||||||||||||||||||||||||||||||||||||||||||||||||||||||||||||||||||||||||||||||||||||||||||||||||||||||||||||||||||||||||||||||
|
‘000
1) A break in time series (more details in the introductory part of the First Release). |
||||||||||||||||||||||||||||||||||||||||||||||||||||||||||||||||||||||||||||||||||||||||||||||||||||||||||||||||||||||||||||||||||||||||||||||||||||||||||||||||||||||||||||||||||||||||||||||||||||||||||||||||||||||||||||||||||||||||||||||||||||||||||||||||||||||||||||||||||||||||||||||||||||||||||||||||||||||||||||||||||||||||||||||||||||||||||||||||||||||||||||||||||||||||||||||||||||||||||||||||||||||||||||||||||||||||||||||||||||||||||||||||||||||||||||||||||||||||||
7 EMPLOYED PERSONS, ACCORDING TO NKD 2007 SECTIONS AND BY SEX |
||||||||||||||||||||||||||||||||||||||||||||||||||||||||||||||||||||||||||||||||||||||||||||||||||||||||||||||||||||||||||||||||||||||||||||||||||||||||||||||||||||||||||||||||||||||||||||||||||||||||||||||||||||||||||||||||||||||||||||||||||||||||||||||||||||||||||||||||||||||||||||||||||||||||||||||||||||||||||||||||||||||||||||||||||||||||||||||||||||||||||||||||||||||||||||||||||||||||||||||||||||||||||||||||||||||||||||||||||||||||||||||||||||||||||||||||||||||||||
|
%
1) A break in time series (more details in the introductory part of the First Release). |
||||||||||||||||||||||||||||||||||||||||||||||||||||||||||||||||||||||||||||||||||||||||||||||||||||||||||||||||||||||||||||||||||||||||||||||||||||||||||||||||||||||||||||||||||||||||||||||||||||||||||||||||||||||||||||||||||||||||||||||||||||||||||||||||||||||||||||||||||||||||||||||||||||||||||||||||||||||||||||||||||||||||||||||||||||||||||||||||||||||||||||||||||||||||||||||||||||||||||||||||||||||||||||||||||||||||||||||||||||||||||||||||||||||||||||||||||||||||||
8 EMPLOYED PERSONS, ACCORDING TO NKZ 2010 MAJOR GROUPS OF OCCUPATIONS AND BY SEX |
||||||||||||||||||||||||||||||||||||||||||||||||||||||||||||||||||||||||||||||||||||||||||||||||||||||||||||||||||||||||||||||||||||||||||||||||||||||||||||||||||||||||||||||||||||||||||||||||||||||||||||||||||||||||||||||||||||||||||||||||||||||||||||||||||||||||||||||||||||||||||||||||||||||||||||||||||||||||||||||||||||||||||||||||||||||||||||||||||||||||||||||||||||||||||||||||||||||||||||||||||||||||||||||||||||||||||||||||||||||||||||||||||||||||||||||||||||||||||||||||||||||||||||||||||||||||||||||||
|
‘000
1) A break in time series (more details in the introductory part of the First Release). |
||||||||||||||||||||||||||||||||||||||||||||||||||||||||||||||||||||||||||||||||||||||||||||||||||||||||||||||||||||||||||||||||||||||||||||||||||||||||||||||||||||||||||||||||||||||||||||||||||||||||||||||||||||||||||||||||||||||||||||||||||||||||||||||||||||||||||||||||||||||||||||||||||||||||||||||||||||||||||||||||||||||||||||||||||||||||||||||||||||||||||||||||||||||||||||||||||||||||||||||||||||||||||||||||||||||||||||||||||||||||||||||||||||||||||||||||||||||||||||||||||||||||||||||||||||||||||||||||
9 AVERAGE HOURS ACTUALLY WORKED ON MAIN JOB DURING REFERENCE WEEK, ACCORDING TO NKD 2007 ACTIVITY SECTIONS AND BY SEX |
||||||||||||||||||||||||||||||||||||||||||||||||||||||||||||||||||||||||||||||||
1) Since 2021, the new binding Regulation (EU) 2019/1700 and the related Commission Implementing Regulation (EU) 2019/2240, concerning the labour force domain, have entered into force. Their implementation caused changes in the methodology and breaks in time series of indicators of working hours, which makes the data from 2021 incomparable with data in previous periods. |
||||||||||||||||||||||||||||||||||||||||||||||||||||||||||||||||||||||||||||||||
10 UNEMPLOYED PERSONS, BY DURATION OF JOB SEARCH |
|||||||||||||||||||||||||||||||||||||||||||||||||||||||||||||||||||||||||||||||||||||||||||||||||||||||||||||||||||||||||||||||||||||||
1) A break in time series (more details in the introductory part of the First Release). |
|||||||||||||||||||||||||||||||||||||||||||||||||||||||||||||||||||||||||||||||||||||||||||||||||||||||||||||||||||||||||||||||||||||||
11 REGISTERED UNEMPLOYED PERSONS, NOT ILO UNEMPLOYED |
|||||||||||||||||||||||||||||||||||||||||||||||||||||||||||||||||||||||||||||||||||||||||||||||||||||||||||||||||||||||||||||||||||||||||||||||||||||||||||||||||||||||||||||||||||||||||||||||||||||||||||||||||||||||||||||||||||||||||||||||||||||||||||||||||||||||||||||||||||||||||||||||||||||||||||||||||||||||||||||||||||||||||||||||||||
1) A break in time series (more details in the introductory part of the First Release). |
|||||||||||||||||||||||||||||||||||||||||||||||||||||||||||||||||||||||||||||||||||||||||||||||||||||||||||||||||||||||||||||||||||||||||||||||||||||||||||||||||||||||||||||||||||||||||||||||||||||||||||||||||||||||||||||||||||||||||||||||||||||||||||||||||||||||||||||||||||||||||||||||||||||||||||||||||||||||||||||||||||||||||||||||||||
12 COMPARISON BETWEEN REGISTERED AND ILO UNEMPLOYMENT, BY SEX |
|||||||||||||||||||||||||||||||||||||||||||||||||||||||||||||||||||||||||||||
1) A break in time series (more details in the introductory part of the First Release). |
|||||||||||||||||||||||||||||||||||||||||||||||||||||||||||||||||||||||||||||
NOTES ON METHODOLOGY
Data sources
The data presented here have been calculated from the data collected in the Labour Force Survey (LFS).
The Labour Force Survey is the most comprehensive official survey on the labour market characteristics in the Republic of Croatia that is conducted on the sample of randomly selected private households.
Data collected by the Labour Force Survey are related to socioeconomic and demographic characteristics of households, with the special emphasis on the status in activity according to the methodological standards of the International Labour Organisation (employed persons, unemployed persons and persons outside the labour force), activity and occupation characteristics on the current, second and previous job, hours of work and working time, unemployment characteristics and educational attainment characteristics.
The Labour Force Survey is harmonised with the EU regulations and Eurostat’s methodology prescribed for the EU-Labour Force Survey (EU-LFS). The Labour Force Survey is binding at the EU level and it is a reference data source that provides observing and comparability of labour market statistics at the international level.
Background
The Labour Force Survey was introduced in the statistical system of the Republic of Croatia in November 1996 as an annual survey. It was carried out in the same manner in June 1997. From 1998 to 2006 it was carried out by interviewing sampled households every month and data were published for each half-year period.
Starting from 2007, the Labour Force Survey has been carried out continuously on a weekly basis, that is, households are interviewed throughout the year. This means that every week is both a reference and an interviewing, i.e. implementation week. The Croatian Bureau of Statistics processes and publishes results in quarterly dynamics.
Since the beginning of 2016, the earlier method of data collection on printed questionnaires was replaced by interviewing methods using laptops and telephones.
Since the beginning of 2021, the new Regulation (EU) 2019/1700 has entered into force, which repealed the Council Regulation (EC) No. 577/98, which was, until then, the fundamental legal basis for conducting the Labour Force Survey.
The implementation of the new legal basis has brought some changes in the survey, starting with changes in the questionnaire design, the application of strictly prescribed and harmonised sequence of questions modification and elimination of the existing questions as well as adding new ones, to changes in the coverage and definitions of employment and unemployment.
In view of the mentioned changes, it was expected that the data released before and after the implementation of the new legal basis would not be consistent and that the changes would cause breaks in time series. The analyses that had been carried out showed that there were no breaks in time series and that the data for 2021 are comparable with data for previous periods. A brief review of the approach and methodology used in these analyses is available at: Methodological summary on the breaks in time series exercise_HR. The exception are indicators on hours of work, where breaks in time series occurred, making those indicators incomparable to data for previous periods.
Data collection
The Labour Force Survey is a panel survey conducted on a weekly basis. Every sampled household is interviewed four times over a year-and-a-half period following the 2- (2) -2 rotation scheme. In other words, households are interviewed in two subsequent quarters, omitted from the sample for the next two quarters and then in the next two subsequent quarters they are interviewed again. This allows for timely monitoring of flows of persons at the labour market, in quarterly and annual dynamics. Every household selected into the sample receives an announcement letter from the Croatian Bureau of Statistics.
Interviews are carried out by applying the CAPI and CATI data collection methods.
The CAPI method (Computer-Assisted Personal Interviewing) includes personal interviewing using laptops. All households selected into the sample for the first time and households that either do not have a telephone/cell phone or do not want, for whatever reason, to be interviewed by telephone, are interviewed in this way.
The CATI method (Computer-Assisted Telephone Interviewing) includes interviewing by telephone from the CATI Centre. All households that accepted in the first interviewing to be interviewed by telephone are interviewed in this way.
Accordingly, interviewers visit private households every week and conduct interviews at selected addresses. The interview lasts approximately 20 minutes. On the basis of the Act on Official Statistics (NN, No. 25/20), all information given by interviewed persons are confidential. The data collected are used for statistical purposes only.
During the COVID-19 pandemic, in the period from 2020 to the second quarter of 2022, the Labour Force Survey was facing difficulties in the collection and processing of data. The data collection was adjusted to the new circumstances and personal interviewing using laptops was partly or entirely replaced by telephone interviewing. In announcement letters sent to the selected addresses, households were asked to provide their phone number if it was not available in the phone book in order to contact them later.
Basic concepts and definitions
The Labour Force Survey measures the economic activity of the population in a short survey period of one week.
Reference period is every week in the whole year.
Target population includes all persons residing in private households who make the usual population of the Republic of Croatia.
A household is a small economic group of persons that is usually, although not always, a group of relatives. There are one-person and multi-person households, providing that the multi-person households consist of two or more persons who jointly reside in a housing unit or a part of it and share costs for food and basic household needs, or jointly contribute to the household income and/or mutually share all or a major part of household costs.
Working-age population is comprised of all persons aged 15 years and over.
Employed persons comprise persons aged 15 to 89 who, during the reference week, were in one of the following categories:
a) persons who during the reference week worked for at least one hour for pay in cash or in kind, including unpaid family workers
b) persons having a job or their own business who were temporarily not at work due to annual leave, working time arrangements, sick leave, maternity or paternity leave, or persons in job-related training.
Accordingly, a pensioner, a housewife, a student or a person not in formal employment can also be classified as employed persons.
Employed persons are also:
– persons on parental leave, either receiving and/or being entitled to job-related income or benefits, or whose parental leave is expected to be three months or less
– seasonal workers during the off-season, where they continue to regularly perform tasks and duties for the job or business, excluding fulfilment of legal or administrative obligations
– persons temporarily not at work for other reasons where the expected duration of the absence is three months or less
– persons that produce agricultural goods whose main part is intended for sale or barter.
Regarding the status in employment, employed persons are classified either as persons in paid employment (employees), as self-employed persons or as unpaid family workers.
Persons in paid employment are those who work for an employer in the state or private sector and are paid for their work in cash or in kind.
Self-employed persons are employers who run an enterprise and employ one or more employees, as well as own-account workers who have no employees.
Unpaid family workers are those who are not in paid employment or self-employment, but work in an enterprise owned by a family member and do not receive a payment for their work. They can also be relatives who do not reside in the same household where the owner of the family business resides.
Unemployed persons are those between 15 and 74 years old, who meet the following three criteria:
a) not employed during the reference week
b) currently available for work, i.e. were available for paid employment or self-employment before the end of the two weeks following the reference week
c) actively seeking work, i.e. had either carried out activities in the four-week period ending with the reference week to seek paid employment or self-employment or found a job to start within a period of at most three months from the end of the reference week.
Active population (labour force) comprises employed and unemployed persons.
Inactive population (persons outside the labour force) comprise persons who are in one of the following categories:
a) aged below 15
b) aged 15 to 89 and neither employed nor unemployed during the reference week
c) aged above 89.
Activity rate represents the labour force as a percentage of the working-age population.
Employment rate represents employed persons as a percentage of working-age population.
Unemployment rate represents unemployed persons as a percentage of the labour force.
In certain tables, the sum total may not equal the sum of individual figures due to the rounding to thousands.
Changes in the Labour Force Survey since 2021
Definition of employment
Until 2020, employed persons included persons who turned 15 years of age and over, while since 2021 and onwards, they have included persons aged from 15 to 89 years.
Persons temporarily not at work but have a job to return to after the reason for their absence ceases to exist have been classified since 2021 as employed only if the total expected duration of their absence is three months or less, i.e. if during their absence they continue to receive income or benefit for their work. Until 2020, all persons temporarily absent from work who had a job to return to after the reason for their absence ceased to exist (irrespective of the reason for absence) were classified as employed persons.
Persons on parental leave have been classified since 2021 as employed only if they either receive and/or are entitled to job-related income or benefits, or if their parental leave is expected to last three months or less. Until 2020, all persons on parental leave were classified as employed persons.
Seasonal workers who did not work in the reference week (off-season period) have been classified since 2021 as employed persons if they continue to regularly perform tasks and duties for the job or business, excluding fulfilment of legal or administrative obligations. Until 2020, seasonal workers were classified as employed persons if they signed a contract/agreement with an employer to return to the same job at the beginning of the new season and/or if they continued to receive at least 50% or more of income or benefits during the off-season.
Persons that produce agricultural goods whose main part is intended for consumption in own household were until 2020 classified as employed persons, while they have been excluded from employment since 2021. Only if the main part of their agricultural production is intended for sale or barter are such persons classified as employed.
Unpaid family workers who perform work for members of their families have been classified since 2021 as employed persons, even if they do not reside in the same household with their relatives who own the trade/enterprise/agricultural holding, while until 2020 they were classified as employed only if they resided in a joint household with them.
Definition of unemployment
Until 2020, unemployed persons included persons who turned 15 years and over, while since 2021 and onwards, they have included persons aged from 15 to 74 years. Changes in the definition of unemployment and inactivity derive from the described changes in definitions of employment.
Questionnaire design
In order to improve the comparability of data across countries, a unique, strictly prescribed and harmonised sequence of questions has been applied for defining of major survey categories (employed persons, unemployed persons, persons outside of the labour force).
Further on, new questions have been introduced (e.g. questions related to migrations, economic and organisational dependence of self-employed persons, etc.). Some questions have been removed, e.g. questions related to the situation of the respondent a year prior to the interview and certain questions concerning informal education characteristics. Particular questions and answers offered to respondents have been changed in order to achieve standardisation of questions in the Labour Force Survey with those in other surveys in the social statistics domain.
In addition, certain blocks of questions have been modified more substantially, e.g. the block of questions related to working hours (contracted working hours have been monitored since 2021 along with usual and actually worked ones, etc.). Moreover, the location of certain blocks of questions in the questionnaire has also been changed.
Survey and administrative sources
Besides survey data on employment and unemployment, the Croatian Bureau of Statistics also publishes data on employment and unemployment according to administrative sources in the Republic of Croatia (including registered unemployment rate).
The following text provides methodological characteristics that cause mutual differences between data on employed persons.
Source and coverage: until 2016, data from administrative sources were based on monthly and annual statistical surveys (RAD-1 and RAD-1G forms) covering employed persons in legal entities of all types of ownership, government bodies and bodies of local and regional self-government units on the territory of the Republic of Croatia. The monthly survey covered 70% of all employed persons in each NKD 2007 division. Since 2016, data on employed persons in legal entities have been gathered by processing data from the “Report on Income, Income Tax and Surtax as well as Contributions for Mandatory Insurances” (JOPPD form), in effect since 1 January 2014, and are not comparable to previously published monthly data. Data on employed persons in crafts and trades and free-lances as well as on employed insured persons – private farmers are taken over from the records on active pension insurance beneficiaries kept by the Croatian Institute for Pension Insurance. The Labour Force Survey results are estimated on the basis of a representative statistical sample of private households in the Republic of Croatia.
Reference period: administrative data on employed persons refer to the last day of the previous month, while the Labour Force Survey data are related to a reference week.
Observation period: administrative data are processed and published in monthly dynamics, while the Labour Force Survey results are related to a quarterly period.
Definitions of employed persons: administrative sources apply the formal definition of employment (persons who have signed the work contract with the employer for a fixed or unspecified period of time, irrespective of type of ownership and of whether they work full time or less than full time), while the Labour Force Survey shows employed persons as all persons who were, in the reference week for at least one hour, engaged in any work for payment in cash or in kind, as well as those who were absent from work during the reference week, but had a job to return to with the same employer after the reason for absence no longer existed.
Released data: administrative data on employed persons are published monthly in the First Release “Persons in Paid Employment, by Activities” and in the Statistics in Line on the web site of the Croatian Bureau of Statistics.
The First Release “Active Population in the Republic of Croatia” is the publications in which survey results on employed persons are published in quarterly dynamics. The RAD-1G annual survey data are also published at lower territorial levels, while the Labour Force Survey results are available at classification levels HR_NUTS 2021 – HR_NUTS 2.
The Croatian Bureau of Statistics of the Republic of Croatia publishes data on unemployed persons taken over from administrative sources as well as those obtained through the Labour Force Survey. These data differ due to the following methodological characteristics.
Source and coverage: data on registered unemployment are obtained from the Register of Unemployed Persons kept by the Croatian Employment Service, while the Labour Force Survey results are collected by interviewing private households. Register contains data on all unemployed persons in the Republic of Croatia, while the Labour Force Survey results are estimated on the basis of the representative statistical sample.
Reference period: the Register data refer to the last day of each month, while the Labour Force Survey data are collected for each reference week.
Observation period: the Register data are taken over in monthly dynamics, while the Labour Force Survey results are processed and published for a quarterly period.
Definitions of unemployed persons: a registered unemployed person is a person aged from 15 to 65 years who is fully or partly capable to work, who is not employed, who is actively seeking job and who is available for work, and a person who meets the criteria as defined in provisions of the Labour Market Act and is registered with the Croatian Employment Service. According to the Labour Force Survey, an unemployed person is, in line with the international definition, either a person who did not perform any work for payment in cash or in kind in the reference week, and was actively seeking job in the course of four weeks before the interview and is prepared to start performing an offered job in the following two weeks, or a person who has found a job and will start working in the next three months.
Released data: data on registered unemployment and registered unemployment rate are published monthly in the First Release “Persons in Employment, by Activities” and in the Statistics in Line on the web site of the Croatian Bureau of Statistics. The First Release “Active Population in the Republic of Croatia” is a publication in which the comparison of unemployment rate obtained from the Labour Force Survey results and the one from administrative sources are published. At the same time, the Croatian Employment Service publishes administrative data on unemployment at lower territorial levels, while the Labour Force Survey data are available at classification levels HR_NUTS 2021 – HR_NUTS 2.
Classifications used
a) The National Classification of Activities, 2007 version, comparable to the international Statistical Classification of Economic Activities in the European Community, NACE Rev. 2, was used in the coding of economic activities.
b) The National Classification of Occupations 2010, NKZ 10, comparable to the International Standard Classification of Occupations, ISCO-08, was used in the coding of occupations.
Coverage and comparability
Data from the 1991 Census on Population, Households and Dwellings were used as a sample frame in the period from 1996 to 1999. In this period, the parts of Croatian territory with still ongoing war operations could not be included in the sample frame.
The database of the Croatian Electrical Utility (HEP) containing data on households spread on the whole Croatian territory was used as a sample frame for 2000 and 2001. Hence, since 2000 the sample and the Labour Force Survey results have related to the whole Republic of Croatia.
Starting from 2002, the sample frame based on the data from the Census of Population, Households and Dwellings in the Republic of Croatia in 2001 had been used for the Labour Force Survey, while since the beginning of 2014, the new sample frame based on the data from the Census of Population, Households and Dwellings in 2011 has been in use.
The Labour Force Survey methodology determines that the population residing in institutions (such as homes, convents, hospitals for long-term treatments, etc.) is not included in the sample frame.
Data revision
In order to achieve consistency and comparability of data for 2014 and onwards with already published data for previous years, the weighting revision has been done on the data for the period from 2007 to 2013, i.e. the data have been weighted according to the results of the Census of Population, Households and Dwellings in the Republic of Croatia in 2011 by using the calibration method. The data were published in the First Release “Active Population in the Republic of Croatia, 2007 – 2013” of 23 December 2014.
Due to the availability of new and more updated estimates of the total population of the Republic of Croatia, the Labour Force Survey data from the fourth quarter of 2015 to the fourth quarter of 2016 have been revised in order to make them in line with the demographic data of the Republic of Croatia. These data were published in the First Release of 11 April 2017, while the data for the remaining three quarters of 2015 are available in the Statistics in Line.
Sample design
The Labour Force Survey is based on a random sample of private households. In the period from 1996 to 2006, the sample was separately defined for each period, that is, the interviews were not repeated, which means that the sample did not have a panel component. As from 2007, the panel component was introduced in the sample design and households were repeatedly interviewed four times. However, since the beginning of 2014, the repeated interviewing of previously selected households has been abandoned due to changes in the methodology of processing and implementation of the Labour Force Survey. Having in mind that the Census of Population, Households and Dwellings in 2011 has been used as a new sample frame, all households in the first quarter of 2014 were selected for the first time, but the interviewing dynamics remained the same.
Since 2014, the new sample design has been determined. The sample consists of four separately selected subsamples, rotation groups (panels). The sample design is two-stage and stratified. The sample frame is stratified in seven strata at classification levels HR_NUTS 2021 – HR_NUTS 2 and further separated into urban and rural parts. The random sample of inhabited dwellings is selected in two stages and the sample design used is a two-stage cluster sampling. Before selecting the sample, the so-called segments are formed. Segments are territorial units formed by grouping of one or several neighbouring enumeration districts, which were established for the purpose of carrying out the Census of Population, Households and Dwellings in 2011.
In the first stage, the random sample of segments is chosen from each stratum and in the second one, the random sample of inhabited dwellings within the selected segments.
During the first two quarters of 2022, the sample size has been gradually enlarged by adding of 325 new households in each panel, i.e. a part of the sample interviewed for the first time, thereby completing the planned enlargement that started in 2021.
On average, 8 580 dwellings are selected in the sample in one quarter. All members of private households permanently living in these dwellings and accepting to participate in the Labour Force Survey were interviewed. In 2023, a total of 36 955 persons aged 15 and over were interviewed in 17 909 households.
Weighting
The weighting procedure is carried out in order to calculate the estimate for the whole household population. This procedure provides for the compensation of the design and sample size impact as well as the impact of the non-response of households to the Labour Force Survey.
Since the beginning of 2014, the new process of weighting the collected data has been determined. In the first phase of the process, the calculation included the weights of the selection of units into the sample taken over from both sampling stages (segments and dwellings) and, in the second one, the weights due to the adjustment to the non-response of units included in the sample. In the last phase of weighting, the final weights calculated in the first two phases were calibrated at the population distribution estimates by age groups, sex and statistical spatial units at 2nd level. Since the first quarter of 2023, the final weights were calibrated according to the Census of Population, Households and Dwellings in 2021, which was updated with data on live births and deaths as well as on population migrations in the Republic of Croatia, whereas for previous years the final weights were calibrated according to the 2011 Census.
The calibration can be described as a process of reweighting aimed at balancing the population estimates by age groups, sex and at classification levels HR_NUTS 2021 – HR_NUTS 2 from the Labour Force Survey, so that these estimates of the survey data correspond to the totals of the entire population, that is, to the distribution of the population of the Republic of Croatia by age groups, sex and classification levels of HR_NUTS 2021 – HR NUTS 2 from the Census of Population, Households and Dwellings in 2021.
The overall non-response rate for 2023 was 42.9% and the refusal rate was 24.3%.
| Abbreviations | |
| EC | European Community |
| EU | European Union |
| CES | Croatian Employment Service |
| COVID-19 | COrona VIrus Disease-19 |
| HR_NUTS 2021 | National Classification of Statistical Regions 2021 |
| HR_NUTS 2 | 2nd level statistical regions |
| ILO | International Labour Organisation |
| NKD 2007 | National Classification of Activities, 2007 version |
| NKZ 10 | National Classification of Occupations, 2010 version |
| NN | Narodne novine, official gazette of the Republic of Croatia |
| NUTS | common classification of territorial units for statistics |
| ‘000 | thousand |
| Symbols | |
| - | no occurrence |
| . | not zero, but extremely inaccurate estimation |
| n | inaccurate estimation |
| p | less accurate estimation |
Published by the Croatian Bureau of Statistics, Zagreb, Ilica 3, P. O. B. 80
Phone: (+385 1) 48 06 111
Press corner: press@dzs.hr
Persons responsible:
Dubravka Rogić-Hadžalić, Director of Demographic and Social Statistics Directorate
Lidija Brković, Director General
Prepared by:
Branka Špoljarić, Marina Munitić, Anita Pavlović, Marija Mišir, Ivana Maričić, Ivana Levačić and Sandra Truntić
USERS ARE KINDLY REQUESTED TO STATE THE SOURCE.
Customer Relations and Data Protection Department
Information and user requests
Phone: (+385 1) 48 06 138, 48 06 154, 48 06 115
E-mail: stat.info@dzs.hr
Subscription
Phone: (+385 1) 21 00 455
E-mail: prodaja@dzs.hr
Ilica 3, 10 000 Zagreb
Republika Hrvatska
Telefon: (+385 1) 48 06 111
Elektronička pošta: stat.info@dzs.hr
Copyright © 2026 Republika Hrvatska - Državni zavod za statistiku
