POPULATION ESTIMATE OF THE REPUBLIC OF CROATIA, 2022
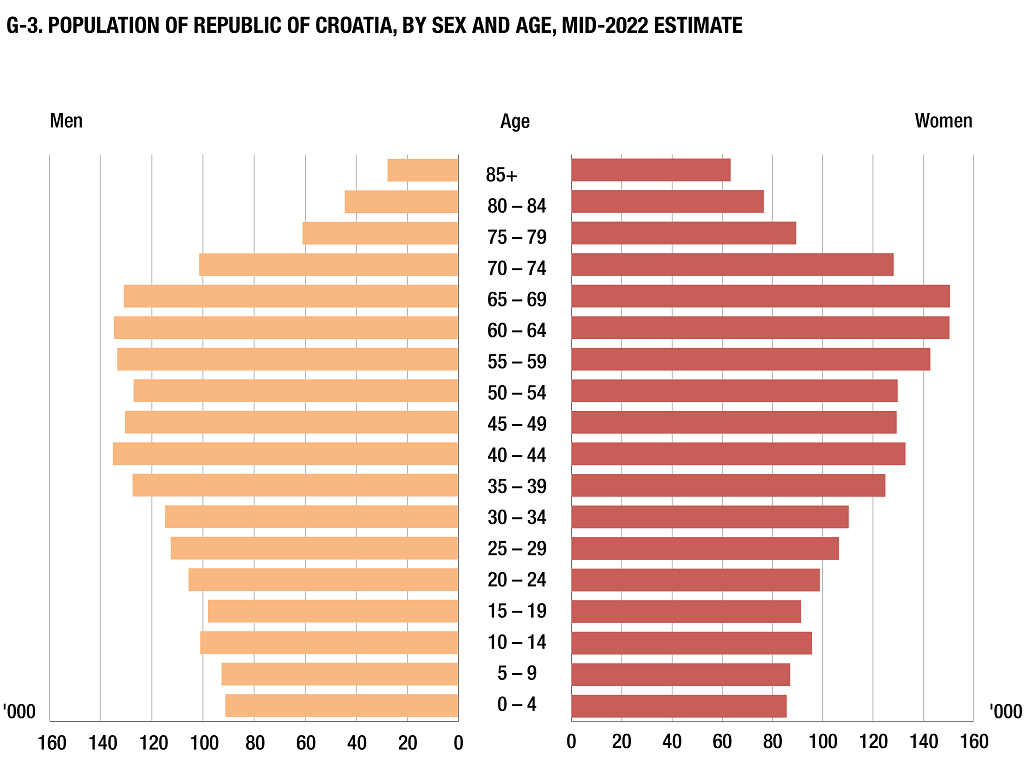
According to the mid-2022 population estimate, the Republic of Croatia had 3 855 641 inhabitants, out of which there were 1 860 511 men and 1 995 130 women.
As compared to the previous year estimate, the population decreased by 23 340 persons or 0.6%.
An increase in the total population was recorded in the County of Zagreb, where, as compared to the previous year estimate, a relative increase of 0.47% was recorded, in the County of Istria (0.33%), and the County of Zadar (0.10%). The decrease in the total population was recorded in all other counties, and the highest relative decrease in the population was recorded in the County of Požega-Slavonia (2.09%), the County of Slavonski Brod-Posavina (1.95%), the County of Virovitica-Podravina (1.92%) and in the County of Vukovar-Sirmium (1.85%).
The share of women in the total population of the Republic of Croatia was 51.7%, while the share of men was 48.3%. Such a ratio was recorded in most counties. The lowest share of female population was recorded in the County of Lika-Senj (50.5%), while the largest share was recorded in the City of Zagreb (53.1%).
In 2022, the continuous ageing of the population kept on. The average age of the total population of the Republic of Croatia was 44.3 years (men 42.6, women 46.0), which places it among the oldest nations in Europe.
The share of youth (0 – 19 years of age) in the total population of the Republic of Croatia amounted to 19.2%. At the county level, the lowest share of youth was in the County of Primorje-Gorski kotar (16.7%) and the highest was in the County of Međimurje (21.5%).
The share of the fertile contingent in the total female population continued to decrease. Therefore, in 2022, it amounted to 39.8%.
As compared to the total population, the largest number of persons aged 65 and over was recorded in the County of Šibenik-Knin (27.6%) and the County of Lika-Senj (26.1%), while the smallest number was recorded in the City of Zagreb (20.7%) and in the County of Međimurje (20.8%).
In the Republic of Croatia, 52.2% of the population lived in only five counties, most of them in the City of Zagreb (767 445 or 19.9%) and the County of Split-Dalmatia (423 400 or 11.0%), while the least populated counties were the County of Lika-Senj (42 578 or 1.1%) and the County of Požega-Slavonia (63 037 or 1.6%).
1 MID-YEAR TOTAL POPULATION ESTIMATE OF THE REPUBLIC OF CROATIA, BY COUNTIES, 2018 – 2022
County of
20181)
20191)
20201)
20212)
20222)
Republic of Croatia
4 087 843
4 065 253
4 047 680
3 878 981
3 855 641
Zagreb
309 469
309 169
309 463
299 983
301 387
Krapina-Zagorje
125 357
124 517
124 110
120 670
119 862
Sisak-Moslavina
148 589
145 904
143 618
140 131
137 603
Karlovac
116 829
115 484
114 269
112 357
110 938
Varaždin
166 982
166 112
165 357
159 747
158 594
Koprivnica-Križevci
107 711
106 367
105 385
101 358
100 366
Bjelovar-Bilogora
107 909
106 258
104 908
102 205
100 397
Primorje-Gorski kotar
284 239
282 730
281 056
266 183
264 267
Lika-Senj
45 184
44 625
44 068
42 931
42 578
Virovitica-Podravina
75 257
73 641
72 378
70 648
69 290
Požega-Slavonia
67 862
66 256
65 134
64 384
63 037
Slavonski Brod-Posavina
140 072
137 487
135 483
130 844
128 288
Zadar
168 153
168 213
167 914
160 085
160 239
Osijek-Baranja
277 227
272 673
269 511
258 719
255 175
Šibenik-Knin
100 153
99 210
98 453
96 722
95 719
Vukovar-Sirmium
154 371
150 985
148 389
143 678
141 025
Split-Dalmatia
448 071
447 747
447 440
423 849
423 400
Istria
208 765
209 573
210 083
195 326
195 970
Dubrovnik-Neretva
121 215
121 816
122 571
115 714
115 049
Međimurje
109 921
109 232
108 822
105 393
105 012
City of Zagreb
804 507
807 254
809 268
768 054
767 445
1) Mid-2018, mid-2019 and mid-2020 population estimates were calculated on the basis of the 2011 Census. 2) Mid-2021 and mid-2022 population estimates were calculated on the basis of the 2021 Census.
G-1 SHARE OF POPULATION IN COUNTIES IN TOTAL POPULATION OF THE REPUBLIC OF CROATIA, MID-2022 ESTIMATE
Source: Croatian Bureau of Statistics
2 AVERAGE AGE, AGEING INDEX AND FERTILE CONTINGENT OF POPULATION OF THE REPUBLIC OF CROATIA
Average age
Ageing index, %
Fertile contingent, 15 – 49, %
Total
Men
Women
Total
Men
Women
Women
1971
34,0
32,4
35,5
47,2
38,5
56,2
51,4
1981
35,4
33,8
37,1
52,6
40,4
65,3
48,5
1991
37,1
35,4
38,7
66,7
50,8
83,3
46,6
2001
39,3
37,5
41,0
90,7
71,6
110,8
46,9
2002
39,6
37,8
41,3
93,8
74,1
114,3
47,1
2003
39,9
38,1
41,5
96,2
76,1
117,2
46,9
2004
40,1
38,3
41,8
98,4
77,8
119,9
46,7
2005
40,3
38,5
42,0
99,6
78,7
121,5
46,4
2006
40,5
38,8
42,2
100,5
79,4
122,6
46,1
2007
40,8
39,0
42,4
103,1
81,7
125,5
45,8
2008
41,0
39,2
42,6
105,2
83,6
127,8
45,6
2009
41,1
39,4
42,8
107,6
85,8
130,4
45,3
2010
41,3
39,5
43,0
110,3
88,5
133,3
45,0
2011
41,8
40,0
43,5
115,7
92,9
139,7
43,8
2012
42,0
40,2
43,7
117,8
95,1
141,7
43,6
2013
42,2
40,3
43,9
121,0
98,0
145,2
43,4
2014
42,4
40,5
44,1
123,9
100,8
148,4
43,1
2015
42,6
40,7
44,3
127,5
104,1
152,2
42,8
2016
42,8
41,0
44,5
132,0
108,2
157,0
42,4
2017
43,1
41,3
44,8
136,9
112,8
162,3
41,9
2018
43,4
41,5
45,0
141,4
116,7
167,5
41,5
2019
43,6
41,8
45,3
145,4
120,5
171,8
41,1
2020
43,8
42,0
45,5
149,3
124,1
176,0
40,8
2021
44,3
42,5
45,9
155,6
130,2
182,5
40,0
2022
44,3
42,6
46,0
156,1
130,6
183,1
39,8
G-2 SHARE OF POPULATION AGED 65 AND OVER IN TOTAL POPULATION, BY COUNTIES, MID-2022 ESTIMATE
Source: Croatian Bureau of Statistics
3 POPULATION ESTIMATE OF THE REPUBLIC OF CROATIA, BY SEX AND SINGLE AGE, MID-2022
(continued)
Age
Total
Men
Women
Age
Total
Men
Women
Total
3 855 641
1 860 511
1 995 130
0
35 441
18 163
17 278
43
54 086
27 248
26 838
1
35 268
18 316
16 952
44
53 196
26 640
26 556
2
35 123
18 009
17 114
45
52 399
26 314
26 085
3
35 384
17 980
17 404
46
52 401
26 186
26 215
4
35 190
18 275
16 915
47
51 707
25 937
25 770
5
35 246
17 998
17 248
48
51 488
25 718
25 770
6
34 439
17 525
16 914
49
51 381
25 761
25 620
7
35 883
18 430
17 453
50
52 177
25 951
26 226
8
36 554
18 831
17 723
51
49 331
24 478
24 853
9
37 210
19 398
17 812
52
50 043
24 675
25 368
10
38 009
19 427
18 582
53
51 575
25 293
26 282
11
38 310
19 764
18 546
54
53 253
26 119
27 134
12
40 692
20 825
19 867
55
55 257
26 806
28 451
13
39 739
20 268
19 471
56
56 345
27 228
29 117
14
39 570
20 223
19 347
57
54 998
26 476
28 522
15
37 445
19 319
18 126
58
53 556
25 892
27 664
16
38 204
19 651
18 553
59
55 609
26 455
29 154
17
39 378
20 361
19 017
60
56 733
26 853
29 880
18
36 914
18 984
17 930
61
56 781
26 814
29 967
19
37 046
19 232
17 814
62
57 859
27 394
30 465
20
37 929
19 590
18 339
63
57 405
27 112
30 293
21
39 120
20 243
18 877
64
55 950
26 043
29 907
22
41 022
21 148
19 874
65
57 391
26 786
30 605
23
41 864
21 590
20 274
66
57 543
26 777
30 766
24
44 081
22 564
21 517
67
58 290
27 189
31 101
25
45 982
23 690
22 292
68
53 446
24 668
28 778
26
44 429
22 901
21 528
69
54 336
24 835
29 501
27
42 720
21 830
20 890
70
48 757
22 104
26 653
28
42 302
21 518
20 784
71
47 886
21 431
26 455
29
43 033
22 069
20 964
72
48 078
21 294
26 784
30
42 593
21 965
20 628
73
44 544
19 174
25 370
31
44 687
22 771
21 916
74
39 930
16 902
23 028
32
44 200
22 413
21 787
75
40 521
17 035
23 486
33
45 656
23 022
22 634
76
27 151
11 121
16 030
34
47 440
24 010
23 430
77
26 240
10 615
15 625
35
47 320
23 865
23 455
78
27 870
10 889
16 981
36
48 492
24 213
24 279
79
28 328
10 910
17 418
37
51 214
25 747
25 467
80
27 735
10 600
17 135
38
52 711
26 765
25 946
81
25 975
9 749
16 226
39
52 122
26 263
25 859
82
24 950
9 054
15 896
40
52 767
26 576
26 191
83
21 808
7 727
14 081
41
53 528
26 992
26 536
84
20 217
6 953
13 264
42
53 984
27 150
26 834
85 +
90 874
27 431
63 443
4 POPULATION ESTIMATE, BY SEX AND AGE GROUPS, BY COUNTIES, MID-2022
Age groups
Republic of Croatia
County of Zagreb
County of Krapina-Zagorje
County of Sisak-Moslavina
Total
Men
Women
Total
Men
Women
Total
Men
Women
Total
Men
Women
Total
3 855 641
1 860 511
1 995 130
301 387
146 467
154 920
119 862
58 398
61 464
137 603
67 211
70 392
0 – 4
176 406
90 743
85 663
14 114
7 190
6 924
5 293
2 686
2 607
5 601
2 930
2 671
5 – 9
179 332
92 182
87 150
14 482
7 374
7 108
5 340
2 751
2 589
5 814
2 974
2 840
10 – 14
196 320
100 507
95 813
16 250
8 363
7 887
5 926
3 039
2 887
6 590
3 282
3 308
15 – 19
188 987
97 547
91 440
15 766
8 193
7 573
5 977
3 089
2 888
6 619
3 362
3 257
20 – 24
204 016
105 135
98 881
16 474
8 469
8 005
6 689
3 389
3 300
7 383
3 859
3 524
25 – 29
218 466
112 008
106 458
17 014
8 820
8 194
6 998
3 611
3 387
7 108
3 832
3 276
30 – 34
224 576
114 181
110 395
17 388
8 900
8 488
7 294
3 808
3 486
6 801
3 612
3 189
35 – 39
251 859
126 853
125 006
19 975
10 118
9 857
7 794
3 987
3 807
8 080
4 248
3 832
40 – 44
267 561
134 606
132 955
21 962
11 211
10 751
7 956
4 104
3 852
8 740
4 498
4 242
45 – 49
259 376
129 916
129 460
21 490
10 883
10 607
8 131
4 101
4 030
9 131
4 718
4 413
50 – 54
256 379
126 516
129 863
20 237
10 182
10 055
8 634
4 385
4 249
9 414
4 776
4 638
55 – 59
275 765
132 857
142 908
20 669
10 005
10 664
9 612
4 788
4 824
10 727
5 375
5 352
60 – 64
284 728
134 216
150 512
20 993
9 746
11 247
9 045
4 519
4 526
11 194
5 412
5 782
65 – 69
281 006
130 255
150 751
21 595
9 853
11 742
8 347
3 931
4 416
11 402
5 357
6 045
70 – 74
229 195
100 905
128 290
17 367
7 649
9 718
6 417
2 842
3 575
9 150
4 013
5 137
75 – 79
150 110
60 570
89 540
11 390
4 757
6 633
4 448
1 758
2 690
5 788
2 323
3 465
80 – 84
120 685
44 083
76 602
8 123
2 989
5 134
3 330
1 027
2 303
4 690
1 639
3 051
85 +
90 874
27 431
63 443
6 098
1 765
4 333
2 631
583
2 048
3 371
1 001
2 370
4 POPULATION ESTIMATE, BY SEX AND AGE GROUPS, BY COUNTIES, MID-2022
(continued)
Age groups
County of Karlovac
County of Varaždin
County of Koprivnica-Križevci
Total
Men
Women
Total
Men
Women
Total
Men
Women
Total
110 938
53 890
57 048
158 594
77 338
81 256
100 366
48 976
51 390
0 – 4
4 456
2 270
2 186
6 785
3 427
3 358
4 624
2 381
2 243
5 – 9
4 674
2 375
2 299
7 027
3 558
3 469
4 732
2 387
2 345
10 – 14
5 177
2 592
2 585
8 100
4 150
3 950
5 224
2 770
2 454
15 – 19
5 194
2 670
2 524
8 330
4 255
4 075
5 206
2 747
2 459
20 – 24
5 426
2 865
2 561
8 861
4 529
4 332
5 466
2 794
2 672
25 – 29
5 388
2 843
2 545
9 007
4 721
4 286
5 534
2 937
2 597
30 – 34
5 927
3 037
2 890
9 328
4 917
4 411
5 469
2 881
2 588
35 – 39
6 998
3 608
3 390
10 746
5 594
5 152
6 264
3 199
3 065
40 – 44
7 566
3 914
3 652
11 441
5 838
5 603
6 669
3 467
3 202
45 – 49
7 352
3 821
3 531
10 955
5 698
5 257
6 570
3 337
3 233
50 – 54
7 475
3 798
3 677
10 976
5 496
5 480
6 931
3 457
3 474
55 – 59
8 656
4 243
4 413
12 025
5 878
6 147
7 737
3 776
3 961
60 – 64
9 198
4 462
4 736
11 874
5 714
6 160
7 741
3 726
4 015
65 – 69
9 036
4 263
4 773
10 850
5 143
5 707
7 412
3 559
3 853
70 – 74
6 782
3 054
3 728
8 591
3 788
4 803
5 903
2 572
3 331
75 – 79
4 454
1 777
2 677
6 006
2 385
3 621
3 899
1 487
2 412
80 – 84
3 808
1 332
2 476
4 460
1 463
2 997
2 906
956
1 950
85 +
3 371
966
2 405
3 232
784
2 448
2 079
543
1 536
4 POPULATION ESTIMATE, BY SEX AND AGE GROUPS, BY COUNTIES, MID-2022
(continued)
Age groups
County of Bjelovar-Bilogora
County of Primorje-Gorski kotar
County of Lika-Senj
Total
Men
Women
Total
Men
Women
Total
Men
Women
Total
100 397
49 002
51 395
264 267
126 623
137 644
42 578
21 073
21 505
0 – 4
4 671
2 380
2 291
10 316
5 323
4 993
1 784
923
861
5 – 9
4 650
2 452
2 198
10 904
5 623
5 281
1 833
949
884
10 – 14
5 154
2 714
2 440
11 963
6 055
5 908
1 878
968
910
15 – 19
5 134
2 631
2 503
11 026
5 658
5 368
1 976
1 025
951
20 – 24
5 486
2 847
2 639
11 436
6 016
5 420
2 195
1 148
1 047
25 – 29
5 477
2 950
2 527
12 940
6 518
6 422
2 267
1 162
1 105
30 – 34
5 189
2 714
2 475
14 736
7 395
7 341
2 294
1 169
1 125
35 – 39
5 932
3 046
2 886
17 362
8 648
8 714
2 423
1 238
1 185
40 – 44
6 264
3 276
2 988
19 643
10 036
9 607
2 561
1 285
1 276
45 – 49
6 431
3 290
3 141
18 460
9 231
9 229
2 624
1 378
1 246
50 – 54
6 662
3 298
3 364
17 424
8 495
8 929
2 917
1 535
1 382
55 – 59
7 668
3 770
3 898
18 654
8 759
9 895
3 376
1 746
1 630
60 – 64
8 069
3 867
4 202
20 776
9 609
11 167
3 345
1 721
1 624
65 – 69
7 951
3 756
4 195
21 556
9 948
11 608
3 377
1 711
1 666
70 – 74
6 398
2 843
3 555
18 858
8 397
10 461
2 576
1 177
1 399
75 – 79
3 918
1 515
2 403
11 486
4 889
6 597
1 805
752
1 053
80 – 84
3 021
998
2 023
9 347
3 593
5 754
1 814
688
1 126
85 +
2 322
655
1 667
7 380
2 430
4 950
1 533
498
1 035
4 POPULATION ESTIMATE, BY SEX AND AGE GROUPS, BY COUNTIES, MID-2022
(continued)
Age groups
County of Virovitica-Podravina
County of Požega-Slavonia
County of Slavonski Brod-Posavina
Total
Men
Women
Total
Men
Women
Total
Men
Women
Total
69 290
33 556
35 734
63 037
30 689
32 348
128 288
62 686
65 602
0 – 4
3 057
1 529
1 528
2 812
1 470
1 342
5 624
2 908
2 716
5 – 9
3 147
1 606
1 541
2 921
1 475
1 446
5 852
3 051
2 801
10 – 14
3 606
1 883
1 723
3 354
1 747
1 607
6 764
3 462
3 302
15 – 19
3 602
1 859
1 743
3 439
1 755
1 684
7 044
3 766
3 278
20 – 24
3 852
2 031
1 821
3 713
1 972
1 741
7 778
4 079
3 699
25 – 29
3 795
1 958
1 837
3 541
1 856
1 685
7 052
3 743
3 309
30 – 34
3 585
1 893
1 692
3 154
1 647
1 507
6 590
3 481
3 109
35 – 39
4 180
2 127
2 053
3 646
1 856
1 790
7 354
3 755
3 599
40 – 44
4 518
2 318
2 200
3 800
1 897
1 903
7 606
3 883
3 723
45 – 49
4 279
2 118
2 161
4 007
1 996
2 011
7 914
3 983
3 931
50 – 54
4 648
2 288
2 360
4 249
2 163
2 086
8 609
4 283
4 326
55 – 59
5 661
2 744
2 917
4 786
2 379
2 407
10 072
4 935
5 137
60 – 64
5 943
2 894
3 049
5 008
2 434
2 574
10 568
5 105
5 463
65 – 69
5 241
2 466
2 775
4 935
2 353
2 582
9 879
4 712
5 167
70 – 74
4 153
1 833
2 320
3 709
1 642
2 067
7 366
3 292
4 074
75 – 79
2 605
978
1 627
2 457
938
1 519
5 146
2 031
3 115
80 – 84
1 980
651
1 329
2 103
707
1 396
4 106
1 391
2 715
85 +
1 438
380
1 058
1 403
402
1 001
2 964
826
2 138
4 POPULATION ESTIMATE, BY SEX AND AGE GROUPS, BY COUNTIES, MID-2022
(continued)
Age groups
County of Zadar
County of Osijek-Baranja
County of Šibenik-Knin
Total
Men
Women
Total
Men
Women
Total
Men
Women
Total
160 239
78 458
81 781
255 175
122 906
132 269
95 719
47 112
48 607
0 – 4
7 492
3 880
3 612
11 130
5 766
5 364
3 829
1 965
1 864
5 – 9
7 675
3 979
3 696
11 565
5 957
5 608
4 026
2 081
1 945
10 – 14
8 307
4 247
4 060
12 497
6 284
6 213
4 422
2 203
2 219
15 – 19
7 895
4 038
3 857
12 766
6 547
6 219
4 380
2 267
2 113
20 – 24
8 667
4 439
4 228
14 295
7 319
6 976
4 961
2 606
2 355
25 – 29
9 247
4 654
4 593
14 641
7 704
6 937
4 903
2 530
2 373
30 – 34
8 983
4 560
4 423
14 254
7 371
6 883
4 852
2 479
2 373
35 – 39
9 839
4 855
4 984
16 200
8 285
7 915
5 493
2 810
2 683
40 – 44
10 591
5 326
5 265
16 549
8 286
8 263
5 891
3 018
2 873
45 – 49
10 590
5 207
5 383
16 126
8 007
8 119
5 914
3 058
2 856
50 – 54
10 160
5 066
5 094
17 227
8 379
8 848
6 135
3 075
3 060
55 – 59
10 786
5 259
5 527
20 115
9 623
10 492
6 890
3 397
3 493
60 – 64
11 374
5 583
5 791
20 720
9 892
10 828
7 610
3 706
3 904
65 – 69
11 791
5 696
6 095
19 999
9 358
10 641
7 989
3 958
4 031
70 – 74
10 449
4 978
5 471
14 795
6 428
8 367
6 834
3 254
3 580
75 – 79
7 008
3 118
3 890
9 717
3 726
5 991
4 226
1 927
2 299
80 – 84
5 440
2 242
3 198
7 510
2 589
4 921
4 212
1 695
2 517
85 +
3 945
1 331
2 614
5 069
1 385
3 684
3 152
1 083
2 069
4 POPULATION ESTIMATE, BY SEX AND AGE GROUPS, BY COUNTIES, MID-2022
(continued)
Age groups
County of Vukovar-Sirmium
County of Split-Dalmatia
County of Istria
Total
Men
Women
Total
Men
Women
Total
Men
Women
Total
141 025
68 352
72 673
423 400
205 457
217 943
195 970
94 845
101 125
0 – 4
6 079
3 170
2 909
20 022
10 305
9 717
8 206
4 176
4 030
5 – 9
6 516
3 391
3 125
20 090
10 394
9 696
8 500
4 417
4 083
10 – 14
7 348
3 765
3 583
22 596
11 537
11 059
9 383
4 891
4 492
15 – 19
7 940
4 039
3 901
22 210
11 426
10 784
8 479
4 437
4 042
20 – 24
8 220
4 323
3 897
24 121
12 229
11 892
8 538
4 400
4 138
25 – 29
7 552
3 960
3 592
25 245
12 723
12 522
9 549
4 833
4 716
30 – 34
7 080
3 680
3 400
25 535
12 881
12 654
11 524
5 881
5 643
35 – 39
8 286
4 255
4 031
27 139
13 710
13 429
13 410
6 652
6 758
40 – 44
8 321
4 133
4 188
28 136
14 032
14 104
14 530
7 409
7 121
45 – 49
8 987
4 647
4 340
28 107
14 068
14 039
13 244
6 698
6 546
50 – 54
9 477
4 765
4 712
28 090
13 894
14 196
12 683
6 171
6 512
55 – 59
11 028
5 388
5 640
28 785
13 967
14 818
14 485
6 880
7 605
60 – 64
11 476
5 531
5 945
30 450
14 414
16 036
15 719
7 465
8 254
65 – 69
11 033
5 106
5 927
29 590
13 875
15 715
15 404
7 211
8 193
70 – 74
8 551
3 707
4 844
24 891
11 147
13 744
12 701
5 821
6 880
75 – 79
5 516
2 115
3 401
15 281
6 451
8 830
7 479
3 235
4 244
80 – 84
4 472
1 495
2 977
13 265
5 206
8 059
6 799
2 623
4 176
85 +
3 143
882
2 261
9 847
3 198
6 649
5 337
1 645
3 692
4 POPULATION ESTIMATE, BY SEX AND AGE GROUPS, BY COUNTIES, MID-2022
(continued)
Age groups
County of Dubrovnik-Neretva
County of Međimurje
City of Zagreb
Total
Men
Women
Total
Men
Women
Total
Men
Women
Total
115 049
56 178
58 871
105 012
51 445
53 567
767 445
359 849
407 596
0 – 4
5 724
2 905
2 819
5 497
2 848
2 649
39 290
20 311
18 979
5 – 9
5 818
2 947
2 871
5 617
2 929
2 688
38 149
19 512
18 637
10 – 14
6 233
3 195
3 038
5 835
2 995
2 840
39 713
20 365
19 348
15 – 19
5 516
2 855
2 661
5 631
2 930
2 701
34 857
17 998
16 859
20 – 24
5 982
3 090
2 892
5 896
3 047
2 849
38 577
19 684
18 893
25 – 29
6 748
3 550
3 198
5 886
3 132
2 754
48 574
23 971
24 603
30 – 34
6 944
3 548
3 396
5 949
3 074
2 875
51 700
25 253
26 447
35 – 39
7 481
3 751
3 730
6 984
3 592
3 392
56 273
27 519
28 754
40 – 44
7 748
3 984
3 764
7 165
3 603
3 562
59 904
29 088
30 816
45 – 49
7 515
3 858
3 657
6 900
3 510
3 390
54 649
26 309
28 340
50 – 54
7 333
3 622
3 711
6 623
3 278
3 345
50 475
24 110
26 365
55 – 59
7 627
3 620
4 007
7 538
3 638
3 900
48 868
22 687
26 181
60 – 64
8 169
3 910
4 259
7 636
3 674
3 962
47 820
20 832
26 988
65 – 69
8 083
3 774
4 309
7 355
3 605
3 750
48 181
20 620
27 561
70 – 74
6 949
3 178
3 771
5 760
2 628
3 132
40 995
16 662
24 333
75 – 79
4 355
1 883
2 472
3 856
1 598
2 258
29 270
10 927
18 343
80 – 84
3 793
1 548
2 245
2 730
895
1 835
22 776
8 356
14 420
85 +
3 031
960
2 071
2 154
469
1 685
17 374
5 645
11 729
NOTES ON METHODOLOGY
Data sources
The following surveys are the data sources for the population estimate of the Republic of Croatia:
- 2011 Census of Population, Households and Dwellings
- 2021 Census of Population, Households and Dwellings
- birth statistics
- death statistics
- statistics of the internal migration of population
- statistics of the international migration of population.
Population estimates for 2018, 2019 and 2020 have been done on the basis of the census data collected in the 2011 Census of Population, Households and Dwellings.
Population estimates for 2021 and 2022 have been done on the basis of the census data collected in the 2021 Census of Population, Households and Dwellings.
The data on births are collected through the Statistical Report on Births (DEM-1) for every entry in the State birth register.
The data on deaths are collected through the Statistical Report on Deaths (DEM-2) for every entry in the State death register.
The surveys on the internal and international migration of population are based on data collected by the Ministry of the Interior.
Coverage
The mid-2018, mid-2019 and mid-2020 population estimates data encompasses all persons included in the total population of the Republic of Croatia in the 2011 Census of Population, Households and Dwellings, all who were born and entered into the State birth register in the period from 1 April 2011 to the estimate date, all persons who died and were entered into the State death register in the period from 1 April 2011 to the estimate date and all persons who immigrated from abroad or emigrated abroad, as well as persons who migrated inside the territory of the Republic of Croatia in the period from 1 April 2011 to the estimate date.
The mid-2021 population estimate data encompasses all persons included in the total population of the Republic of Croatia in the 2021 Census of Population, Households and Dwellings, all who were born and entered into the State birth register in the period from the estimate date to 31 August 2021, all persons who died and were entered into the State death register in the period from the estimate date to 31 August 2021 and all persons who immigrated from abroad or emigrated abroad, as well as persons who migrated inside the territory of the Republic of Croatia in the period from the estimate date to 31 August 2021.
The mid-2022 population estimate data encompasses all persons included in the total population of the Republic of Croatia in the 2021 Census of Population, Households and Dwellings, all who were born and entered into the State birth register in the period from 1 September 2021 to the estimate date, all persons who died and were entered into the State death register in the period from 1 September 2021 to the estimate date and all persons who immigrated from abroad or emigrated abroad, as well as persons who migrated inside the territory of the Republic of Croatia in the period from 1 September 2021 to the estimate date.
Definitions and explanations
Mid-2018, mid-2019 and mid-2020 population estimates were calculated on the basis of the 2011 Census, natural change and net migration data.
Mid-2021 and mid-2022 population estimates were calculated on the basis of the 2021 Census, natural change and net migration data.
In the 2011 Censusand 2021 Census, according to the international statistical standards, the concept of the place of usual residence is used in defining the total population. The place of usual residence is considered a place where a person spends most of his/her daily period of rest, irrespective of a short-term absence from it (e.g. due to going on a vacation, trip, medical treatment, visit etc.). In line with the definition of the place of usual residence, the total population includes the following persons:
- those who have lived in their place of usual residence for a continuous period of at least 12 months before the Census reference time
- those who arrived in their place of usual residence during the 12 months before the Census reference time with the intention of staying there for at least one year.
A live born child(live birth) is every child who at birth exhibits signs of life, such as breathing, beating of the heart, pulsation of the umbilical cord or definite movements of voluntary muscles.
A deceased person (death) is every live born person in whom there is a permanent disappearance of all evidence of life.
Natural increase is the difference between the number of live births and the number of deaths.
Data by age are expressed by completed years of age on the reference date. The data by age groups include persons who reached the age within the limits of an interval.
Average age indicates the mean age of the total population and it is calculated as the arithmetic mean of the age of the total population.
Ageing index represents the ratio of the population, that is, the share (%) of inhabitants aged 60 and over in the number of inhabitants aged from 0 to 19 inclusive.
Fertile female population includes women between 15 and 49 years of age.
Place of permanent residence, according to Article 2 of the Permanent Residence Act (NN, Nos 144/12 and 158/13) is "a place and address in the Republic of Croatia where a person has settled with an intention of staying permanently in order to exercise his or her rights and commitments related to life interests such as family, professional, economic, social, cultural and other interests".
Immigrated or emigrated population is the population that changed its place of usual residence on the territory of the Republic of Croatia or that changed its country of usual residence for a period that is, or is expected to be, of at least one year.
Net migration of population (migration balance) is the difference between the number of immigrants and the number of emigrants of a particular area or country in a given period of time.
Territorial constitution
The data are presented by territorial constitution according to the Act on the Territories of Counties, Towns and Municipalities in the Republic of Croatia (NN, No. 86/06), with the situation as on 31 December 2022.
Abbreviations
NN
Narodne novine, official gazette of the Republic of Croatia
'000
thousand
Published by the Croatian Bureau of Statistics, Zagreb, Ilica 3, P. O. B. 80. Phone: (+385 1) 48 06 111 Press corner: press@dzs.hr
Persons responsible: Dubravka Rogić-Hadžalić, Director of Demographic and Social Statistics Directorate Lidija Brković, Director General
Prepared by: Tatjana Radić and Andrea Zebec
USERS ARE KINDLY REQUESTED TO STATE THE SOURCE.
Customer Relations and Data Protection Department
Information and user requests Phone: (+385 1) 48 06 138, 48 06 154 E-mail: stat.info@dzs.hr