
First Release
CONSUMER PRICE INDICES, JANUARY 2022
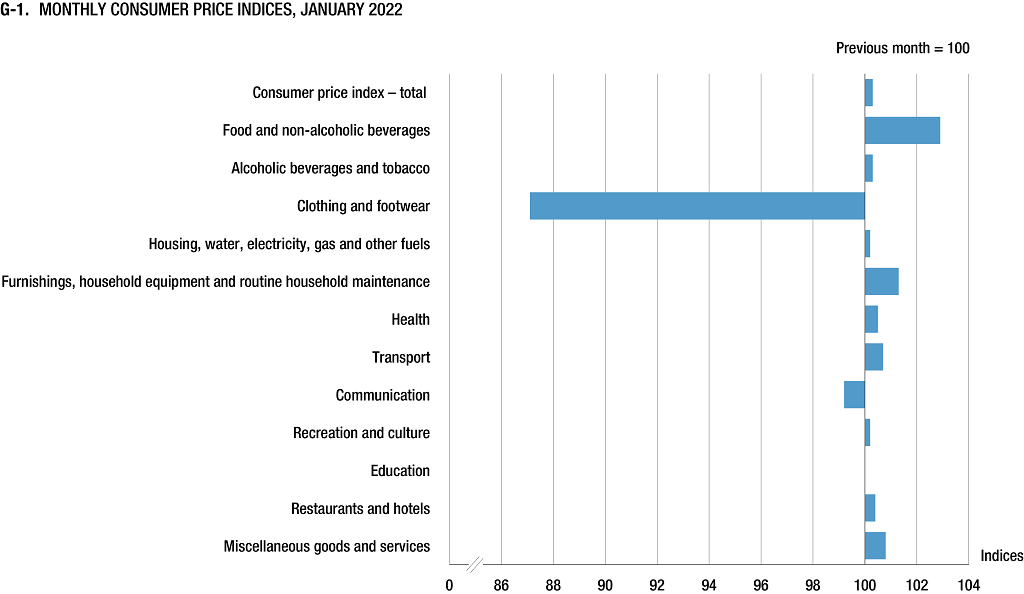
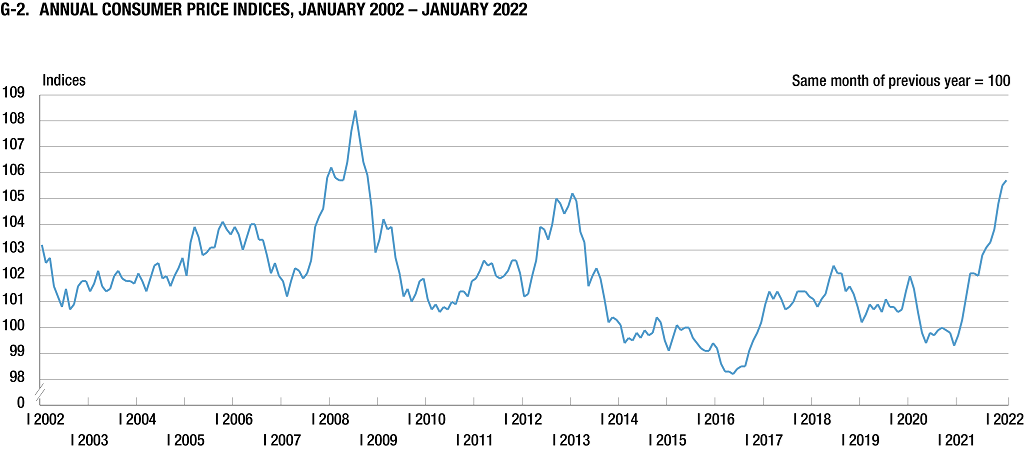
In January 2022 compared to December 2021, the prices of goods and services for personal consumption, measured by the consumer price index, increased by 0.3% on average. Compared to January 2021, that is, at the annual level, they increased by 5.7% on average, while on the annual average, they increased by 3.1%.
Observing the main divisions of the ECOICOP classification, at the annual level, the highest increase on average in consumer prices was recorded in the following divisions: Transport, of 10.8%, Food and non-alcoholic beverages, of 9.4%, Alcoholic beverages and tobacco, of 6.2%, Furnishings, household equipment and routine household maintenance, of 5.0%, Restaurants and hotels, of 4.7%, Miscellaneous goods and services, of 3.1%, Housing, water, electricity, gas and other fuels as well as Recreation and culture, of 2.7% in each group.
The largest contribution to the growth rate of the annual index came from the following divisions: Food and non-alcoholic beverages (+2.44 percentage points), Transport (+1.59 percentage points), Housing, water, electricity, gas and other fuels (+0.46 percentage points) and Alcoholic beverages and tobacco (+0.32 percentage points).
Observing the selected groups, the highest increase in consumer prices at the annual level was recorded in the group Unprocessed food, of 10.3% on average (contribution to the growth of +0.87 percentage points) and in the group Energy, of 10.2% (+1.71 percentage points).
At the monthly level, the highest increase on average in consumer prices was recorded in the following divisions: Food and non-alcoholic beverages, of 2.9% (contribution to the growth of +0.75 percentage points), Furnishings, household equipment and routine household maintenance, of 1.3% (+0.07 percentage points), Miscellaneous goods and services, of 0.8% (+0.05 percentage points) and Transport, of 0.7% (+0.10 percentage points, due to higher prices of fuels and lubricants for personal transport equipment). The increase in prices was alleviated by a decrease in the prices of Clothing and footwear, of 12.9% (-0.75 percentage points, due to seasonal discounts of clothing and footwear) and Communication, of 0.8% (-0.04 percentage points).
Harmonised index of consumer prices
The prices of goods and services for personal consumption, measured by the harmonised index of consumer prices, increased by 0.4% on average in January 2022 compared to December 2021. Compared to January 2021, that is, at the annual level, they increased by 5.5% on average, while on the annual average, they increased by 3.1%.
1 CONSUMER PRICE INDICES, JANUARY 20221) |
||||||||||||||||||||||||||||||||||||||||||||||||||||||||||||||||||||||||||||||||||||||||||||||||||
1) Time series of consumer price indices according to the ECOICOP classification can be downloaded on the website of the Croatian Bureau of Statistics within the Databases section under PC AXIS Databases. |
||||||||||||||||||||||||||||||||||||||||||||||||||||||||||||||||||||||||||||||||||||||||||||||||||
|
|
|
|
2 CONSUMER PRICE INDICES, BY SELECTED GROUPS, JANUARY 2022 |
||||||||||||||||||||||||||||||||||||||||||||||||||||||||||||||||||||||||||||||||||||||||||
|
3 HARMONISED INDICES OF CONSUMER PRICES, JANUARY 2022, RATES OF CHANGE1) |
||||||||||||||||||||||||||||||||||||||||||||||||||||||||||||||||||||||||||||||||||||
1) Time series of the harmonised index of consumer prices according to the ECOICOP classification can be downloaded on the website of the Croatian Bureau of Statistics within the Statistics in Line section under Prices and on the Eurostat website. |
||||||||||||||||||||||||||||||||||||||||||||||||||||||||||||||||||||||||||||||||||||
NOTES ON METHODOLOGY
Definitions
Consumer price index (CPI) is used as a general measure of inflation in the Republic of Croatia and reflects the changes in prices of goods and services acquired, used or paid over time by a reference population (private households) for consumption purposes. In addition, it is used to guarantee the value of contracts with index clauses (e.g. for indexing wages and salaries in collective agreements, for indexing pensions, etc.), as well as for the comparison of the price movements within a particular country between different economy sectors, it can serve as a basis for deflating individual categories of national accounts data and other statistical series, as well as for analytical purposes.
Harmonised index of consumer prices (HICP) is a set of European consumer price indices calculated according to a harmonised approach and a special set of definitions, which enable a comparable measure of inflation in the euro area, the European Union, the European Economic Area and in candidate countries.
CPI and HICP are calculated on the basis of the same representative basket of goods and services. The main difference is the coverage of the population (HICP includes the total consumption of institutional households and non-residents in the economic territory and this consumption is not included in the national consumer price index).
While the consumer price index is most often applied as a general measure of inflation within the national framework, the harmonised index of consumer prices is a comparable measure of inflation among the countries of the European Union.
Coverage and price collection
The representative basket for monitoring consumer prices consists of about 900 products. About 38 000 prices are collected each month in predefined outlets. The CPI covers all goods and services purchased by the reference population for the purpose of final consumption. Imputed rents, expenditure on lotteries and gambling, as well as life insurance services are not included.
The coverage of goods and services is revised once a year in order to ensure the representativeness of the basket with respect to consumer tastes and their purchasing habits.
By updating the basket for 2022, the following new goods and services were introduced: new and used SUV motor cars, electric scooters, video streaming services, smart watches, COVID-19 home test kits, PCR testing for COVID-19, box shipments, video game consoles and vinyl flooring. At the same time, navigation systems (GPS), MP3/MP4 players and car radios were excluded from the basket for 2022.
Most of the prices of goods and services from the basket are collected by authorised price collectors using tablet computers at nine geographical locations (Zagreb, Slavonski Brod, Osijek, Sisak, Rijeka, Pula, Split, Dubrovnik and Varaždin). For the selected products from the basket, price collectors independently choose a specific product offer whose price will be recorded at the outlet. In order to make sure that collectors record the prices of the same items each month, as well as to monitor which product offers are selected at outlets, price collectors also record a pre-defined set of additional product characteristics. Such a method of price collection enables the monitoring of changes in prices between two periods, but not the comparison of average prices between different geographic locations.
In addition to the prices collected directly by price collectors at outlets (local price collection), data on nationally homogenous prices are collected directly from reporting units or via the internet (central price collection). Since January 2021, the prices for selected groups of products (market rents, house appliances and electronics) are collected using the web scraping technique.
The majority of prices are collected once a month, on a working day (prices are not collected during weekends and public holidays), on approximately the same day of the month. The prices of agricultural products sold in market places, the prices of passenger air transport and the prices collected using the web scraping technique are recorded twice a month. The prices of fuel for passenger cars, the prices of package holidays, the prices of apartment rents and the prices of accommodation in camps are recorded weekly. The prices of school books and education fees are recorded once a year.
In the context of the COVID-19 pandemic, the data on retail prices that could not be collected are treated in accordance with the Eurostat recommendations for the harmonised index of consumer prices. The guidelines define the following basic principles, which are applied accordingly: the stability of the weighting structure, the calculation of the index for all categories of the ECOICOP classification and the minimisation of the number of imputed prices. According to the recommendations, indices are marked as having low reliability if the number of imputed prices for an aggregate exceeds 50% or if the weight of the imputed part of an aggregate exceeds 50%.
Weights
The weights used for calculating the indices reflect the relative importance of the sampled goods or services in the total consumption of households within the domestic territory.
The main data source for determining the weights used in the calculation of the CPI is the Household Budget Survey, conducted on a regular basis by the Croatian Bureau of Statistics since 1998. This data source is supplemented by available additional data sources. Since January 2022, the compilation of CPIs has been based on the weights derived from data on household expenditures from the 2019 Household Budget Survey recalculated to December 2021 prices. The COVID-19 pandemic has largely affected household personal consumption and therefore, for the calculation of weights in 2022, data from the 2019 Household Budget Survey were further updated with estimated national accounts data on household final consumption expenditure for 2021.
The main data source for determining the weights for the calculation of the HICP at higher levels of aggregation are the national accounts data, and for lower levels of aggregation, the data from the Household Budget Survey are used. Since January 2022, the calculation of the HICP has been based on estimated national accounts data on household final consumption expenditure for 2021, supplemented by additional available data sources and recalculated to the difference between the 2021 average and December 2021 according to the Eurostat recommendations.
Classification
The European Classification of Individual Consumption according to Purpose (ECOICOP) is used for the classification of products.
Calculation of indices
The calculation of the CPIs begins with the computation of the elementary aggregate indices.
The elementary aggregate indices are compiled as a ratio of the geometric means of prices for each geographical location. It means that prices for product-offers within elementary aggregates in the current month are compared to prices of the reference period (December of the previous year). From elementary aggregate indices at the level of geographical locations, elementary aggregate indices at national level are then calculated using the formula for the weighted arithmetic mean.
Elementary aggregate indices at national level are aggregated to higher index levels using the Laspeyres’ type formula.
Harmonised index of consumer prices at constant tax rates (HICP-CT)
HICP-CT is the harmonised index of consumer prices where the rates of taxes on products are kept constant in the observation period compared to the reference period, i.e. through time. In the event of a tax rate change, the difference between the current HICP-CT and HICP indicates the effect of the tax rate change on the price changes assuming that changes in tax rates are applied instantaneously and fully.
Time series of the total HICP-CT can be downloaded on the website of the Croatian Bureau of Statistics within the Statistics in Line section under Prices, while a detailed breakdown according to the ECOICOP classification is available on the Eurostat website.
Abbreviations
| COVID-19 | Corona VIrus Disease-19 |
| EU | European Union |
| Eurostat | Statistical Office of the European Communities |
Published by the Croatian Bureau of Statistics, Zagreb, Ilica 3, P. O. B. 80
Phone: (+385 1) 48 06 111
Press corner: press@dzs.hr
Persons responsible:
Suzana Šamec, Director of Macroeconomic Statistics Directorate
Lidija Brković, Director General
Prepared by:
Sanja Jurleka, Marija Gudelj, Snježana Strukar, Jasminka Stančić, Marita Novoselec, Gordana Šiletić and Ivana Ključarić
USERS ARE KINDLY REQUESTED TO STATE THE SOURCE.
Customer Relations and Data Protection Department
Information and user requests
Phone: (+385 1) 48 06 138, 48 06 154
E-mail: stat.info@dzs.hr
Subscription
Phone: (+385 1) 48 06 115
E-mail: prodaja@dzs.hr
Ilica 3, 10 000 Zagreb
Republic of Croatia
Phone: (+385 1) 48 06 111
E-Mail: stat.info@dzs.hr
Copyright © 2026 Republic of Croatia - Croatian Bureau of Statistics
