
First Release
LABOUR FORCE IN THE REPUBLIC OF CROATIA, 2020 ANNUAL AVERAGE
In accordance with the sample design and methods of data collection, the Labour Force Survey provides data on economic activity of the population in the Republic of Croatia in quarterly and annual dynamics.
Due to the COVID-19 pandemic in 2020, the Labour Force Survey is facing difficulties in the collection, verification and processing of data. Since the second quarter of 2020, the data collection has been adjusted to new circumstances, and thus telephone interviewing mostly replaced ″face-to-face″ interviewing.
In announcement letters sent to the selected addreses, when a phone number was not available in the phone book, households were asked to provide their phone number for enabling interviewers to contact them and conduct the Survey.
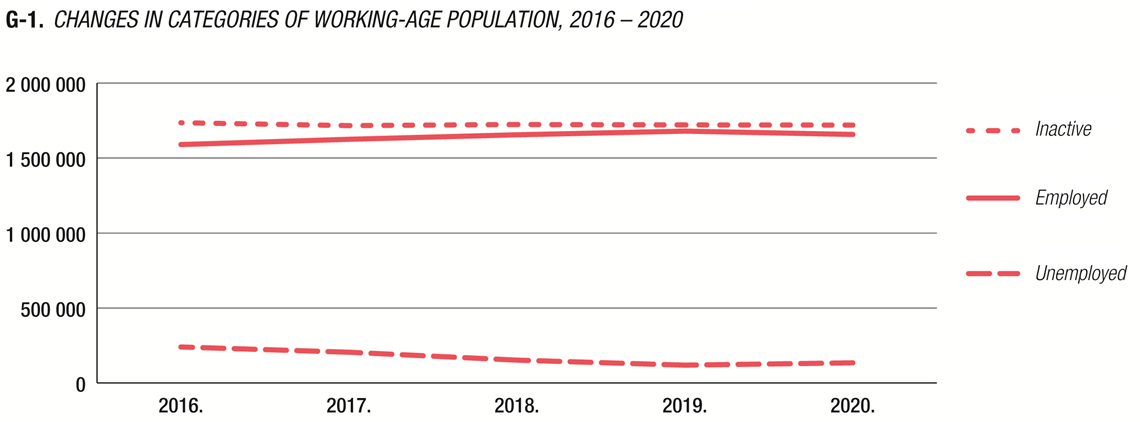
Data in this First Release for the period from 2016 to 2020 are averages of four quarterly results.
As the methodology for the Survey is harmonised with the regulations of the Eurostat, the results for the Republic of Croatia are regularly published on the web pages and in Eurostat's publications, thus enabling the comparison of the Republic of Croatia with all EU Member States.
A continuous application of methodological guidelines of the Eurostat and the International Labour Organisation ensured that the Labour Force Survey results clearly point out to trends in the labour market of the Republic of Croatia.
|
|
|
|
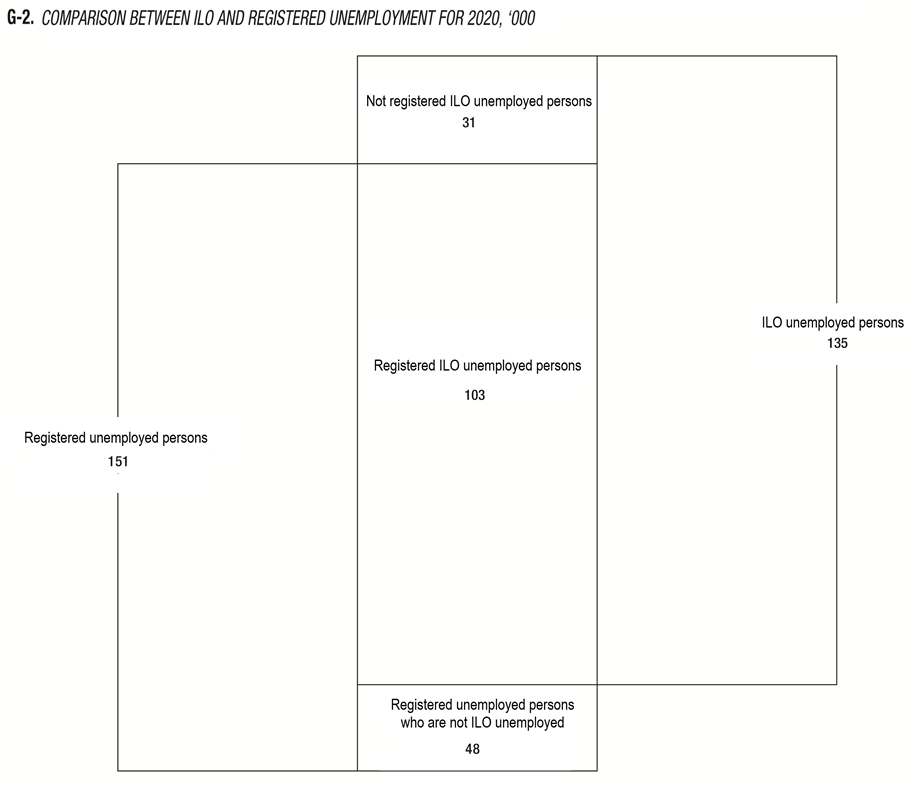
The comparison of unemployment data obtained by the Labour Force Survey with those according to the Croatian Employment Service (CES) and those obtained from other administrative data records shows that the average unemployment rate for 2020, according to the administrative records, was higher (8.9%) than the ILO unemployment rate (7.5%). In the same period, the average number of unemployed persons according to the Survey was by 16 000 persons lower than the number obtained from the CES. Since interviewed persons provided information on their registration with the CES, the data comparison shows that 103 000, or 76.5%, out of the total of 135 000 unemployed persons were registered with the CES, 23.3% of persons who were classified as unemployed in the Labour Force Survey were not interested in registering with the CES and the remaining 0.2% did not respond to the question on the registration. At the same time, 48 000, or 31.7%, of the total of 151 000 persons who were registered with the CES did not fulfil the international criteria of unemployment.
1 WORKING-AGE POPULATION, BY ACTIVITY AND SEX |
||||||||||||||||||||||||||||||||||||||||||||||||||||||||||||||||||||||||||||||||||||||||||||||||||||||||||||||||||||||||||||||||||||||||||||||||||||||||||
|
'000
|
||||||||||||||||||||||||||||||||||||||||||||||||||||||||||||||||||||||||||||||||||||||||||||||||||||||||||||||||||||||||||||||||||||||||||||||||||||||||||
2 WORKING-AGE POPULATION, BY ACTIVITY, AGE AND SEX |
||||||||||||||||||||||||||||||||||||||||||||||||||||||||||||||||||||||||||||||||||||||||||||||||||||||||||||||||||||||||||||||||||||||||||||||||||||||||||||||||||||||||||||||||||||||||||||||||||||||||||||||||||||||||||||||||||||||||||||||||||||||||||||||||||||||||||||||||||||||||||||||||||||||||||||||||||||||||||||||||||||||||||||||||||||||||||||||||||||||||||||||||||||||||||||||||||||||||||||||||||||||||||||||||||||||||||||||||||||||||||||||||||||||||||||||||||||||||||||||||||||||||||||||||||||||||||||||||||||||||||||||||||||||||||||||||||||||||||||||||||||||||||||||||||||||||||||||||||||||||||||||||||||||||||||||||||||||||||||||||||||||||||||||||||||||||||
|
'000
|
||||||||||||||||||||||||||||||||||||||||||||||||||||||||||||||||||||||||||||||||||||||||||||||||||||||||||||||||||||||||||||||||||||||||||||||||||||||||||||||||||||||||||||||||||||||||||||||||||||||||||||||||||||||||||||||||||||||||||||||||||||||||||||||||||||||||||||||||||||||||||||||||||||||||||||||||||||||||||||||||||||||||||||||||||||||||||||||||||||||||||||||||||||||||||||||||||||||||||||||||||||||||||||||||||||||||||||||||||||||||||||||||||||||||||||||||||||||||||||||||||||||||||||||||||||||||||||||||||||||||||||||||||||||||||||||||||||||||||||||||||||||||||||||||||||||||||||||||||||||||||||||||||||||||||||||||||||||||||||||||||||||||||||||||||||||||||
3 POPULATION ACTIVITY MEASURES, BY AGE AND SEX |
|||||||||||||||||||||||||||||||||||||||||||||||||||||||||||||||||||||||||||||||||||||||||||||||||||||||||||||||||||||||||||||||||||||||||||||||||||||||||||||||||||||||||||||||||||||||||||||||||||||||||||||||||||||||||||||||||||||||||||||||||||||||||||||||||||||||||||||||||||||||||||||||||||||||||||||||||||||||||||||||||||||||||||||||||||||||||||||||||||||||||||||||||||||||||||||||||||||||||||||||||||||||||||||||||||||||||||||||||||||||||||||||||||||||||||||||||||||||||||||||||||||||||||||
|
%
|
|||||||||||||||||||||||||||||||||||||||||||||||||||||||||||||||||||||||||||||||||||||||||||||||||||||||||||||||||||||||||||||||||||||||||||||||||||||||||||||||||||||||||||||||||||||||||||||||||||||||||||||||||||||||||||||||||||||||||||||||||||||||||||||||||||||||||||||||||||||||||||||||||||||||||||||||||||||||||||||||||||||||||||||||||||||||||||||||||||||||||||||||||||||||||||||||||||||||||||||||||||||||||||||||||||||||||||||||||||||||||||||||||||||||||||||||||||||||||||||||||||||||||||||
4 SHARE IN WORKING-AGE POPULATION, BY EDUCATIONAL ATTAINMENT AND SEX |
|||||||||||||||||||||||||||||||||||||||||||||||||||||||||||||||||||||||||||||||||||||||||||||||||||||||||||||||||||||||||||||||||||||||||||||||||||||||||||||||||||||||||||||||||||||||||||||||||||||||||||||||||||||||
|
%
|
|||||||||||||||||||||||||||||||||||||||||||||||||||||||||||||||||||||||||||||||||||||||||||||||||||||||||||||||||||||||||||||||||||||||||||||||||||||||||||||||||||||||||||||||||||||||||||||||||||||||||||||||||||||||
5 PERSONS IN EMPLOYMENT, BY STATUS IN EMPLOYMENT AND SEX |
|||||||||||||||||||||||||||||||||||||||||||||||||||||||||||||||||||||||||||||||||||||||||||||||||||||||||||||||||||||||||||||||||||||||||||||||||||||||||||
|
'000
|
|||||||||||||||||||||||||||||||||||||||||||||||||||||||||||||||||||||||||||||||||||||||||||||||||||||||||||||||||||||||||||||||||||||||||||||||||||||||||||
6 PERSONS IN EMPLOYMENT, ACCORDING TO NKD 2007. AND BY SEX |
|||||||||||||||||||||||||||||||||||||||||||||||||||||||||||||||||||||||||||||||||||||||||||||||||||||||||||||||||||||||||||||||||||||||||||||||||||||||||||||||||||||||||||||||||||||||||||||||||||||||||||||||||||||||||||||||||||||||||||||||||||||||||
|
'000
1) Due to unreliable estimates marked by ((.)), data do not add up to the total. |
|||||||||||||||||||||||||||||||||||||||||||||||||||||||||||||||||||||||||||||||||||||||||||||||||||||||||||||||||||||||||||||||||||||||||||||||||||||||||||||||||||||||||||||||||||||||||||||||||||||||||||||||||||||||||||||||||||||||||||||||||||||||||
7 PERSONS IN EMPLOYMENT, ACCORDING TO NKD 2007. AND BY SEX |
|||||||||||||||||||||||||||||||||||||||||||||||||||||||||||||||||||||||||||||||||||||||||||||||||||||||||||||||||||||||||||||||||||||||||||||||||||||||||||||||||||||||||||||||||||||||||||||||||||||||||||||||||||||||||||||||||||||||||||||||||||||||||
|
%
1) Due to unreliable estimates marked by ((.)), data do not add up to the total. |
|||||||||||||||||||||||||||||||||||||||||||||||||||||||||||||||||||||||||||||||||||||||||||||||||||||||||||||||||||||||||||||||||||||||||||||||||||||||||||||||||||||||||||||||||||||||||||||||||||||||||||||||||||||||||||||||||||||||||||||||||||||||||
8 PERSONS IN EMPLOYMENT, ACCORDING TO NKZ 10. MAJOR GROUPS OF OCCUPATIONS AND BY SEX |
|||||||||||||||||||||||||||||||||||||||||||||||||||||||||||||||||||||||||||||||||||||||||||||||||||||||||||||||||||||||||||||||||||||||||||||||||||||||||||||||||||||||||||||||||||||||||||||||||||||||||||||||||||||||||||||||||||||||||||||||||||||||||||||||||||||||||||||
|
'000
1) Due to unreliable estimates marked by ((.)), data do not add up to the total. |
|||||||||||||||||||||||||||||||||||||||||||||||||||||||||||||||||||||||||||||||||||||||||||||||||||||||||||||||||||||||||||||||||||||||||||||||||||||||||||||||||||||||||||||||||||||||||||||||||||||||||||||||||||||||||||||||||||||||||||||||||||||||||||||||||||||||||||||
9 AVERAGE HOURS ACTUALLY WORKED ON MAIN JOB DURING REFERENCE WEEK, ACCORDING TO NKD 2007. ACTIVITY SECTIONS AND BY SEX |
||||||||||||||||||||||||||||||||||||||||||||||||||||||||||||||||||||||||||||||||
|
||||||||||||||||||||||||||||||||||||||||||||||||||||||||||||||||||||||||||||||||
10 UNEMPLOYED PERSONS, BY DURATION OF JOB SEARCH |
|||||||||||||||||||||||||||||||||||||||||||||||||||||||||||||||||||||||
1) Due to non-response of respondents, a sum of low-level data does not add up to the total. |
|||||||||||||||||||||||||||||||||||||||||||||||||||||||||||||||||||||||
11 REGISTERED UNEMPLOYED PERSONS, NOT ILO UNEMPLOYED |
|||||||||||||||||||||||||||||||||||||||||||||||||||||||||||||||||||||||||||||||||||||||||||||||||||||||||||||||||||||||||||||||||||||||||||||||||||||||||||||||||||||||||||||||||||
1) Due to non-response of respondents, a sum of low-level data does not add up to the total. |
|||||||||||||||||||||||||||||||||||||||||||||||||||||||||||||||||||||||||||||||||||||||||||||||||||||||||||||||||||||||||||||||||||||||||||||||||||||||||||||||||||||||||||||||||||
12 COMPARISON BETWEEN REGISTERED AND ILO UNEMPLOYMENT, BY SEX |
|||||||||||||||||||||||||||||||||||||||||||||||||||||||||||||||||||||||||||||
1) Rates were calculated from final revised administrative data. |
|||||||||||||||||||||||||||||||||||||||||||||||||||||||||||||||||||||||||||||
NOTES ON METHODOLOGY
The Labour Force Survey is the most comprehensive survey on labour market characteristics based on the household sample in the Republic of Croatia. It is aimed at collecting data on the situation and changes on the Croatian labour market, that is, data on size, structure and characteristics of active and inactive population.
The Survey is carried out in compliance with methodological rules and guidelines of the International Labour Organisation (ILO), adopted at the 13th Conference of Labour Statisticians and Eurostat, which enables methodological comparability of surveys in EU countries. The application of this methodological foundation is a prerequisite for obtaining internationally comparable data in the area of labour statistics, which enables the comparison of the Republic of Croatia with other countries.
The collected data are significant for purposes of monitoring, measuring and assessing of economic and social trends in the Republic of Croatia and, at the same time, they allow for the use of modern analytical methods in economics, sociology, psychology, etc., serving also as a basis for employment policy programmes.
Data collection
In the Republic of Croatia, the Labour Force Survey was for the first time carried out in November 1996 as an annual survey. It was carried out in the same manner in June 1997. In order to fulfil the need for more frequent data collection than just once a year, and following the example of European countries and recommendations of international institutions, in the period from 1998 to 2006 the Labour Force Survey was carried out by interviewing a part of sampled households every month. Data are processed and published for each half-year period. In 2006, the Croatian Bureau of Statistics set preconditions for improving the Labour Force Survey in its methodology and organisation, aiming at obtaining more precise results and achieving the complete harmonisation with the Acquis Communaitaire. Therefore, starting from 2007, the Labour Force Survey has been carried out continuously, that is, households are interviewed throughout the year. This means that every week is both reference and interviewing week. Collected data are continuously submitted to the Croatian Bureau of Statistics, which has processed and published results in quarterly dynamics since the beginning of 2007 as well as annual averages for the previous four years since 2010.
Since the beginning of 2016, the earlier method of data collection “on paper” (PAPI, Paper-Assisted Personal Interview) has been replaced by new interviewing methods, CAPI and CATI.
The CAPI method (Computer-Assisted Personal Interviewing) includes interviewing “face to face” via laptops. All households selected in the sample for the first time and households who either do not have a telephone/cell phone or do not want, for whatever reason, be interviewed by telephone are interviewed in this way.
The CATI method (Computer-Assisted Telephone Interviewing) includes interviewing by phone from the CATI Center. All households who accepted in the first interviewing to be interviewed by phone are interviewed in this way.
Accordingly, interviewers visit households every week and conduct interviews at sampled addresses, which takes approximately 20 minutes. On the basis of the Act on Official Statistics (NN, No. 25/20), all information given by interviewed persons are confidential. The data collected are used for statistical purposes only.
Since the beginning of 2016, field interviewing via laptops has been carried out by approximately 80 interviewers, whose work is organised and monitored by 22 supervisors. Supervisors check filled-in electronic questionnaires submitted by interviewers and, in cooperation with interviewers, correct detected errors before sending the questionnaires to the Croatian Bureau of Statistics. Telephone interviewing is carried out by two interviewers in the CATI Center in Zagreb, who are constantly monitored by supervisors.
Basic concepts and definitions
The Labour Force Survey measures the economic activity of population in a short survey period of one week. The reference week for the Survey, which has been carried out in the Republic of Croatia since the beginning of 2007, is every week throughout the year.
A household is a small economic group of persons that is usually, although not always, a group of relatives living together and sharing costs of living (housing, food, etc.).
Working-age population comprises all persons aged 15 years and over.
Persons in employment are those who were engaged in any work for payment in cash or kind during the reference week. Those are employees, the self-employed, and family members who are helping in some kind of family business (family enterprise, firm, craft,
free-lance, farm) or some other kind of gainful activity, as well as persons who worked on contract, for direct payment in cash or kind. Therefore, the Survey covers all persons who worked for at least
one hour in the reference period, irrespective of their formal status or means of payment. In this way, a retired person, a student or a housewife can also be classified as employed.
Persons in employment are also those who were absent from work during the reference week but had a job to return to with the same employer after the reason for absence no longer existed.
Persons in paid employment are those who work for an employer in the state or private sector and are paid for their work in money or kind.
Self-employed persons are employers who run an enterprise and employ one or more employees, as well as own-account workers who have no employees.
Unpaid family workers are those who are not in paid employment or self-employment, but work in an enterprise owned by a family member and do not receive a payment for their work.
Unemployed persons are those who meet the following three criteria:
a) in the reference period did not work for payment in cash or kind;
b) were actively seeking work during four weeks prior to the Survey;
c) were currently available for work within the next two weeks.
Those who have found a job to start in the future are also included.
Underemployed persons are those who usually work less than 36 hours per week but would like to work more and are prepared to accept more work in the next two weeks (within their present work, with additional work or with other work).
Currently active population or the labour force consists of persons whose activity status in the reference week is either employed or unemployed.
Inactive population consists of persons under the age of 15 as well as those of working age who are neither employed nor unemployed.
Target population covered by the Survey is determined by the presence of interviewed household members in the household. The definition of presence is based on the "de facto" principle, which excludes household members living at some other address for more than 12 months, as well as temporarily present members of another household. The Survey does not cover collective households such as student homes, convents, etc.
Activity rate represents the labour force as a percentage of the working-age population.
Employment/population ratio represents persons in employment as a percentage of working-age population.
Unemployment rate represents unemployed persons as a percentage of the labour force.
In certain tables, the sum total may not equal the sum of individual figures due to the rounding to thousands.
Since 1996, in accordance with the experience of most developed countries and based on the data available from administrative sources and the Labour Force Survey, the Croatian Bureau of Statistics of the Republic of Croatia has published two differently defined unemployment rates and related data on active population or labour force.
Besides survey data, the Croatian Bureau of Statistics publishes administrative data on employment and unemployment in the Republic of Croatia.
Methodological characteristics that cause differences in data on persons in employment are given below.
Source and coverage: Until 2016, data from administrative sources were based on monthly and annual statistical surveys (RAD-1 and RAD-1G forms) covering persons in employment in legal entities of all types of ownership, government bodies and bodies of local and regional self-government units on the territory of the Republic of Croatia. The monthly survey covers 70% of all persons in employment classified in all NKD 2007. divisions. Since 2016, data on persons in employment in legal entities have been gathered by processing data from the Report on Income, Income Tax and Surtax as well as on Contributions for Mandatory Insurances (JOPPD form – a single form encompassing several forms related to taxation), which has been in effect since 1 January 2014. They are not comparable to previously published monthly data. Data on persons in employment in crafts and trades and free-lances as well as on employed insured persons – private farmers are taken over from records on active pension insurance beneficiaries kept by the Croatian Institute for Pension Insurance. The Labour Force Survey results are estimated on the basis of a representative statistical sample of private households in the Republic of Croatia.
Reference period: Administrative data on persons in employment refer to the last day of a previous month, while the Labour Force Survey data are related to a reference week.
Observation period: Administrative data are processed and published in monthly dynamics, while the Labour Force Survey results are related to a quarterly period.
Definition of persons in employment: Administrative sources apply the formal definition of employment (persons who have signed the work contract with the employer for a fixed or unspecified period of time, irrespective of type of ownership and of whether they work full time or less than full time), while the Labour Force Survey shows persons in employment as all persons who were, in the reference week, engaged in any work for payment in cash or kind, as well as those who were absent from work during the reference week, but had a job to return to with the same employer after the reason for absence no longer existed.
Data publishing: Administrative data on persons in employment are published monthly in the First Release titled Persons in Paid Employment by Activity, in the annual First Release titled Persons in Employment by Activity and by Sex – Final Data and in the Statistics in Line on the web site of the Croatian Bureau of Statistics.
The First Release and the Statistical Report containing the Labour Force Survey results are publications in which survey results on persons in employment are published in the quarterly dynamics. The RAD-1G annual survey data are also published at lower territorial levels, while the Survey results are available at NUTS 2 level.
The Croatian Bureau of Statistics of the Republic of Croatia publishes data on unemployed persons taken over from administrative sources as well as those obtained through the Labour Force Survey. These data differ due to the following methodological characteristics.
Source and coverage: Data on registered unemployment are obtained from the Register of Unemployed Persons kept by the CES, while the Labour Force Survey results are collected by interviewing private households. Register contains data on all unemployed persons in the Republic of Croatia, while the Labour Force Survey results are estimated on the basis of the representative statistical sample.
Reference period: The Register data refer to the last day of each month, while the Labour Force Survey data are collected for each reference week.
Observation period: The Register data are taken over in monthly dynamics, while the Labour Force Survey results are processed and published for a quarterly period.
Definition of unemployed persons: A registered unemployed person is a person who is registered with the CES, that is, each person who meets criteria defined by the Act on Job Placement and Unemployment Insurance and the CES. According to the Labour Force Survey, an unemployed person is either a person who did not perform any work for payment in cash or kind in the reference week, and was actively seeking work in the course of four weeks before the interview and is prepared to start an offered job in the following two weeks or a person who has found a job and will start working shortly after the interview.
Publication: Data on registered unemployment and registered unemployed rate are published monthly in the First Release titled "Persons in Employment, by Activity and by Sex" as well as in the Statistics in Line of the Croatian Bureau of Statistics. The First Release and Statistical Report containing the quarterly Labour Force Survey results are publications in which the comparison of unemployment rate obtained from the Survey results and the one from administrative sources are published. At the same time, the CES publishes administrative data on unemployment at lower territorial levels, while the Survey data are available at NUTS 2 level.
The data show that the unemployment rate based on the administrative data sources is higher than the Labour Force Survey rate. This is, on one hand, due to the fact that some categories of population formally classified as unemployed or inactive are nevertheless active, and on the other, administrative sources, besides really unemployed persons, include a significant share of persons who are not classified as unemployed according to the definition of the Survey, but are through this status entitled to some social or economic rights and benefits.
Classifications used
a) The National Classification of Activities, 2007 version, comparable to the international classification of activities NACE Rev. 2, was used in the economic activity coding.
b) The National Classification of Occupations, NKZ 10., comparable to the International Standard Classification of Occupations, ISCO-08, was used in the coding of occupations.
Coverage and comparability
Data from the 1991 Census on Population, Households and Dwellings were used as a sample frame in the period from 1996 to 1999. In this period, parts of Croatian territory with still ongoing war operations could not be included in the sample frame.
The database of the Croatian Electrical Utility containing data on households spread on the whole Croatian territory was used as a sample frame for 2000 and 2001. Hence, for the first time, the sample and the Survey results, since 2000, have related to the whole of the Republic of Croatia.
Starting from the first half-year of 2002, the sample frame based on the Census 2001 data was used for the Labour Force Survey, while, since the beginning of 2014, the new sample frame based on the data from the Census of Population, Households and Dwellings in 2011 has been in use.
Methodology of the Survey determines that the population residing in institutions (such as homes, convents, hospitals for long-term treatments, etc.) is not included in the sample frame.
Sample design
The Labour Force Survey is based on the random sample of private households. In the period from 1996 to 2006, the sample was separately defined for each period, that is, the sample did not have a panel component. Since 2007, such component has been introduced in the sample design and households are interviewed four times. However, since the beginning of 2014, the repeated interviewing of previously selected households has been abandoned due to changes in the methodology of processing and implementation of the Survey. Having in mind that the 2011 Census has been used as a new sample frame, all households in the first quarter of 2014 were selected for the first time, but the interviewing dynamics remained the same.
The interviewing dynamics is the following: households are interviewed in two consecutive quarters, left out in the following two quarters and interviewed again in two consecutive quarters. In this way, it is possible to observe flows on the labour market over time in both the quarterly and annual dynamics.
Furthermore, the new sample design has been determined. The sample consists of four separately selected subsamples, rotation groups or panels. The sample design is two-stage and stratified. The sample frame is stratified in four strata at NUTS 2 level and according to ther further breakdown to urban and rural parts. The random sample of occupied dwellings is selected in two stages and the sample design used is a two-stage cluster sampling. Before selecting the sample, the so-called segments are formed. Segments are territorial units formed by grouping of one or several neighbouring enumeration districts, which were established for the purpose of carrying out the 2011 Census.
In the first stage the random sample of segments is chosen from each stratum and in the second one the random sample of inhabited dwellings within the selected segments. All private households living in the chosen dwellings are interviewed.
In an average quarter, the sample consists of 7 280 dwellings. All members of all private households permanently living in these dwellings are interviewed. In 2020, there were 31 642 persons aged 15 years and over interviewed in 14 469 households.
Weighting
The weighting procedure is carried out in order to calculate the estimate for the whole household population. This procedure provides for the compensation of the design and sample size impact as well as the impact of the non-response of households to the Survey.
Since the beginning of 2014, the new process of weighting of collected data has been determined. In the first phase of the process, the calculation included the weights of the selection of units into the sample taken over from both sampling stages (segments and dwellings) and, in the second one, it included the weights due to the adjustment to the non-response of units included in the sample. In the last weighting phase, the final weights calculated in the first two phases were calibrated at the population distribution estimates by age, sex and statistical spatial units at the NKPJS level 2 according to the 2011 Census, which was updated with data on live births and deaths as well as on population migrations in the Republic of Croatia.
The calibration can be described as a process of reweighting aimed at balancing the population estimates by age, sex and at the NUTS 2 level from the Survey, in other words, the distribution of the population of the Republic of Croatia by age, sex and statistical spatial units at NKPJS level 2 from the 2011 Census.
The overall non-response rate for 2020 was 43.0% and the refusal rate was 24.1%.
| Abbreviations | |
| CES | Croatian Employment Service |
| COVID-19 | COrona VIrus Disease-19 |
| ILO | International Labour Organisation |
| NKD 2007. | National Classification of Activities, 2007 version |
| NKPJS | Nomenclature of Territorial Units for Statistics |
| NKZ 10. | National Classification of Occupations, 2010 version |
| NN | Narodne novine, official gazette of the Republic of Croatia |
| NUTS | common classification of territorial units for statistics |
| PAPI | Paper-Assisted Personal Interview |
| ‘000 | Thousand |
| Symbols | |
| - | no occurrence |
| . | not zero, but extremely inaccurate estimation |
| (( )) | inaccurate estimation |
| ( ) | less accurate estimation |
Published by the Croatian Bureau of Statistics, Zagreb, Ilica 3, P. O. B. 80.
Phone: (+385 1) 4806-111, Fax: (+385 1) 4817-666
Press corner: press@dzs.hr
Persons responsible:
Dubravka Rogić-Hadžalić, Director of Demographic and Social Statistics Directorate
Lidija Brković, Director General
Prepared by: Branka Špoljarić, Marina Munitić, Anita Pavlović, Marija Mišir, Ivana Levačić i Sandra Truntić
USERS ARE KINDLY REQUESTED TO STATE THE SOURCE.
Customer Relations and Data Protection Department
Information and user request
Phone: (+385 1) 4806-138, 4806-154
E-mail: stat.info@dzs.hr
Fax: (+385 1) 4806-148
Subscription
Phone: (+385 1) 4806-115
E-mail: prodaja@dzs.hr
Fax: (+385 1) 4806-148
Ilica 3, 10 000 Zagreb
Republic of Croatia
Phone: (+385 1) 48 06 111
E-Mail: stat.info@dzs.hr
Copyright © 2026 Republic of Croatia - Croatian Bureau of Statistics
