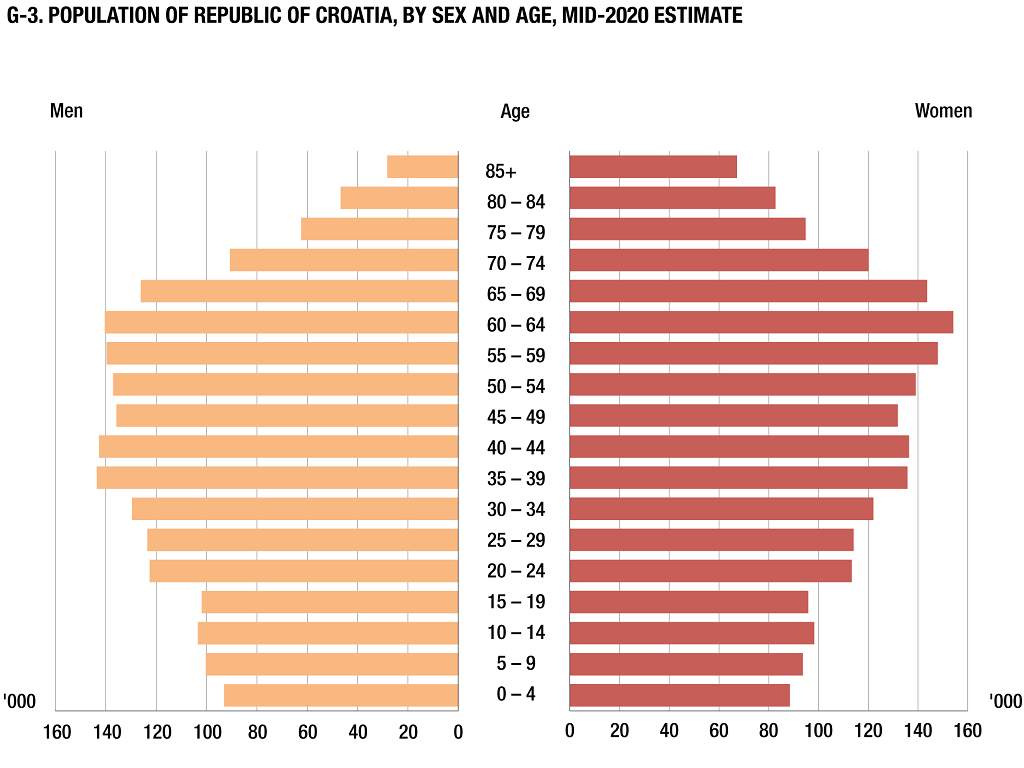
According to the mid-2020 population estimate, the Republic of Croatia had 4 047 680 inhabitants, out of which there were 1 967 680 men and 2 080 000 women.
A decrease in population continued in 2020. As compared to the previous year estimate, the population decreased by 17 573 persons or 0.4%.
An increase in the total population was recorded in the County of Dubrovnik-Neretva, where, as compared to the previous year estimate, a relative increase of 0.62% was recorded, in the City of Zagreb (0.25%), the County of Istria (0.24%), and the County of Zagreb (0.10%). The decrease in the total population was recorded in all other counties, and the highest relative decrease in the population was recorded in the County of Vukovar-Sirmium (1.72%), the County of Virovitica-Podravina (1.72%) and the County of Požega-Slavonia (1.69%).
The share of women in the total population of the Republic of Croatia was 51.4%, while the share of men was 48.6%. Such a ratio was recorded in most counties. The lowest share of female population was recorded in the County of Lika-Senj (49.8%), while the largest share was recorded in the City of Zagreb (52.8%).
In 2020, the continuous ageing of the population kept on. The average age of the total population of the Republic of Croatia was 43.8 years (men 42.0, women 45.5), which places it among the oldest nations in Europe.
The ageing process was to a great degree caused by the multi-year drop in the share of youth (0 – 19 years of age) in the total population. At the country level, this share amounted to 19.1% in 2020, while at the county level, it was the lowest in the County of Primorje-Gorski kotar (16.4%) and the highest in the County of Međimurje (21.7%).
The share of the fertile contingent in the total female population continued to decrease. Therefore, in 2020, it amounted to 40.8%.
As compared to the total population, the largest number of persons aged 65 and over was recorded in the County of Šibenik-Knin (26.3%) and the County of Lika-Senj (25.3%), while the smallest number was recorded in the County of Međimurje (19.4%).
In the Republic of Croatia, 52.3% lived in only five counties, most of them in the City of Zagreb (809 268 or 20.0%) and the County of Split-Dalmatia (447 440 or 11.1%), while the least populated counties were the County of Požega-Slavonia (65 134 or 1.6%) and the County of Lika-Senj (44 068 or 1.1%).
1 MID-YEAR TOTAL POPULATION ESTIMATE OF REPUBLIC OF CROATIA, BY COUNTIES, 2016 – 2020
County of
2016
2017
2018
2019
2020
Republic of Croatia
4 174 349
4 124 531
4 087 843
4 065 253
4 047 680
Zagreb
314 549
311 416
309 469
309 169
309 463
Krapina-Zagorje
127 748
126 334
125 357
124 517
124 110
Sisak-Moslavina
157 204
152 546
148 589
145 904
143 618
Karlovac
120 321
118 263
116 829
115 484
114 269
Varaždin
170 563
168 560
166 982
166 112
165 357
Koprivnica-Križevci
110 976
109 137
107 711
106 367
105 385
Bjelovar-Bilogora
111 867
109 822
107 909
106 258
104 908
Primorje-Gorski kotar
289 479
286 677
284 239
282 730
281 056
Lika-Senj
46 888
45 943
45 184
44 625
44 068
Virovitica-Podravina
79 111
77 086
75 257
73 641
72 378
Požega-Slavonia
71 920
69 583
67 862
66 256
65 134
Slavonski Brod-Posavina
148 373
143 827
140 072
137 487
135 483
Zadar
169 581
168 672
168 153
168 213
167 914
Osijek-Baranja
290 412
283 035
277 227
272 673
269 511
Šibenik-Knin
103 021
101 436
100 153
99 210
98 453
Vukovar-Sirmium
165 799
159 213
154 371
150 985
148 389
Split-Dalmatia
452 035
449 610
448 071
447 747
447 440
Istria
208 105
208 229
208 765
209 573
210 083
Dubrovnik-Neretva
121 970
121 381
121 215
121 816
122 571
Međimurje
112 089
110 999
109 921
109 232
108 822
City of Zagreb
802 338
802 762
804 507
807 254
809 268
G-1 SHARE OF POPULATION IN COUNTIES IN TOTAL POPULATION OF REPUBLIC OF CROATIA, MID-2020 ESTIMATE
Source: Croatian Bureau of Statistics
2 AVERAGE AGE, AGEING INDEX AND FERTILE CONTINGENT OF POPULATION OF THE REPUBLIC OF CROATIA
Average age
Ageing index, %
Fertile contingent, 15 – 49, %
Total
Men
Women
Total
Men
Women
Women
1971
34,0
32,4
35,5
47,2
38,5
56,2
51,4
1981
35,4
33,8
37,1
52,6
40,4
65,3
48,5
1991
37,1
35,4
38,7
66,7
50,8
83,3
46,6
2001
39,3
37,5
41,0
90,7
71,6
110,8
46,9
2002
39,6
37,8
41,3
93,8
74,1
114,3
47,1
2003
39,9
38,1
41,5
96,2
76,1
117,2
46,9
2004
40,1
38,3
41,8
98,4
77,8
119,9
46,7
2005
40,3
38,5
42,0
99,6
78,7
121,5
46,4
2006
40,5
38,8
42,2
100,5
79,4
122,6
46,1
2007
40,8
39,0
42,4
103,1
81,7
125,5
45,8
2008
41,0
39,2
42,6
105,2
83,6
127,8
45,6
2009
41,1
39,4
42,8
107,6
85,8
130,4
45,3
2010
41,3
39,5
43,0
110,3
88,5
133,3
45,0
2011
41,8
40,0
43,5
115,7
92,9
139,7
43,8
2012
42,0
40,2
43,7
117,8
95,1
141,7
43,6
2013
42,2
40,3
43,9
121,0
98,0
145,2
43,4
2014
42,4
40,5
44,1
123,9
100,8
148,4
43,1
2015
42,6
40,7
44,3
127,5
104,1
152,2
42,8
2016
42,8
41,0
44,5
132,0
108,2
157,0
42,4
2017
43,1
41,3
44,8
136,9
112,8
162,3
41,9
2018
43,4
41,5
45,0
141,4
116,7
167,5
41,5
2019
43,6
41,8
45,3
145,4
120,5
171,8
41,1
2020
43,8
42,0
45,5
149,3
124,1
176,0
40,8
G-2 SHARE OF POPULATION AGED 65 AND OVER IN TOTAL POPULATION, BY COUNTIES, MID-2020 ESTIMATE
Source: Croatian Bureau of Statistics
3 POPULATION ESTIMATE OF REPUBLIC OF CROATIA, BY SEX AND SINGLE AGE, MID-2020
(continued)
Age
Total
Men
Women
Age
Total
Men
Women
Total
4 047 680
1 967 680
2 080 000
0
36 105
18 506
17 599
43
54 864
27 959
26 905
1
36 498
18 571
17 927
44
54 785
27 929
26 856
2
36 381
18 902
17 479
45
54 063
27 520
26 543
3
36 804
18 822
17 982
46
53 895
27 372
26 523
4
35 757
18 248
17 509
47
53 839
27 441
26 398
5
37 393
19 280
18 113
48
54 253
27 360
26 893
6
38 141
19 657
18 484
49
51 649
26 162
25 487
7
38 920
20 375
18 545
50
51 921
25 956
25 965
8
39 681
20 388
19 293
51
53 537
26 600
26 937
9
39 834
20 549
19 285
52
55 322
27 655
27 667
10
42 135
21 519
20 616
53
57 059
28 138
28 921
11
40 932
20 908
20 024
54
58 360
28 715
29 645
12
40 652
20 763
19 889
55
57 054
27 986
29 068
13
38 490
19 866
18 624
56
55 607
27 316
28 291
14
39 519
20 340
19 179
57
57 654
27 954
29 700
15
40 685
20 955
19 730
58
58 785
28 287
30 498
16
37 932
19 443
18 489
59
58 620
28 199
30 421
17
38 158
19 634
18 524
60
59 931
28 782
31 149
18
39 485
20 326
19 159
61
59 396
28 503
30 893
19
41 511
21 505
20 006
62
57 664
27 363
30 301
20
43 655
22 562
21 093
63
58 659
27 850
30 809
21
44 862
23 270
21 592
64
58 921
27 901
31 020
22
47 801
24 674
23 127
65
59 714
28 446
31 268
23
50 402
26 376
24 026
66
54 929
25 982
28 947
24
49 321
25 742
23 579
67
55 716
25 936
29 780
25
47 233
24 454
22 779
68
49 892
23 043
26 849
26
46 710
24 063
22 647
69
49 519
22 639
26 880
27
47 581
24 833
22 748
70
49 740
22 270
27 470
28
47 003
24 641
22 362
71
46 298
19 935
26 363
29
49 028
25 521
23 507
72
42 273
18 080
24 193
30
48 332
25 036
23 296
73
42 955
18 094
24 861
31
49 418
25 424
23 994
74
29 596
12 296
17 300
32
51 254
26 448
24 806
75
29 206
11 973
17 233
33
50 689
26 168
24 521
76
31 509
12 624
18 885
34
52 039
26 529
25 510
77
32 554
12 915
19 639
35
54 935
28 155
26 780
78
32 515
12 703
19 812
36
56 241
29 102
27 139
79
31 359
12 188
19 171
37
55 376
28 412
26 964
80
30 562
11 571
18 991
38
55 981
28 720
27 261
81
27 356
9 983
17 373
39
56 851
29 162
27 689
82
26 034
9 314
16 720
40
56 973
29 242
27 731
83
24 050
8 478
15 572
41
56 750
29 137
27 613
84
21 440
7 384
14 056
42
55 731
28 399
27 332
85 +
95 446
28 251
67 195
4 POPULATION ESTIMATE, BY SEX AND AGE GROUPS, BY COUNTIES, MID-2020
Age groups
Republic of Croatia
County of Zagreb
County of Krapina-Zagorje
County of Sisak-Moslavina
Total
Men
Women
Total
Men
Women
Total
Men
Women
Total
Men
Women
Total
4 047 680
1 967 680
2 080 000
309 463
151 412
158 051
124 110
60 810
63 300
143 618
70 216
73 402
0 – 4
181 545
93 049
88 496
13 481
6 865
6 616
5 176
2 667
2 509
6 029
3 092
2 937
5 – 9
193 969
100 249
93 720
14 695
7 550
7 145
5 612
2 859
2 753
6 457
3 263
3 194
10 – 14
201 728
103 396
98 332
16 635
8 523
8 112
5 997
3 080
2 917
7 038
3 587
3 451
15 – 19
197 771
101 863
95 908
16 305
8 391
7 914
6 238
3 253
2 985
7 310
3 707
3 603
20 – 24
236 041
122 624
113 417
18 455
9 628
8 827
7 473
3 828
3 645
8 627
4 529
4 098
25 – 29
237 555
123 512
114 043
17 884
9 386
8 498
7 461
3 918
3 543
7 531
3 967
3 564
30 – 34
251 732
129 605
122 127
18 883
9 770
9 113
7 797
4 139
3 658
7 613
4 085
3 528
35 – 39
279 384
143 551
135 833
21 548
11 198
10 350
8 227
4 276
3 951
8 684
4 577
4 107
40 – 44
279 103
142 666
136 437
22 651
11 628
11 023
8 232
4 286
3 946
9 051
4 717
4 334
45 – 49
267 699
135 855
131 844
21 525
10 988
10 537
8 356
4 244
4 112
9 170
4 754
4 416
50 – 54
276 199
137 064
139 135
21 288
10 700
10 588
9 369
4 755
4 614
10 194
5 270
4 924
55 – 59
287 720
139 742
147 978
21 205
10 344
10 861
9 714
4 934
4 780
10 910
5 437
5 473
60 – 64
294 571
140 399
154 172
22 118
10 381
11 737
9 276
4 628
4 648
11 392
5 590
5 802
65 – 69
269 770
126 046
143 724
20 701
9 669
11 032
7 956
3 793
4 163
10 526
4 959
5 567
70 – 74
210 862
90 675
120 187
15 817
6 879
8 938
6 016
2 570
3 446
8 001
3 428
4 573
75 – 79
157 143
62 403
94 740
11 575
4 812
6 763
4 774
1 847
2 927
6 273
2 395
3 878
80 – 84
129 442
46 730
82 712
8 355
3 006
5 349
3 720
1 121
2 599
5 201
1 792
3 409
85 +
95 446
28 251
67 195
6 342
1 694
4 648
2 716
612
2 104
3 611
1 067
2 544
4 POPULATION ESTIMATE, BY SEX AND AGE GROUPS, BY COUNTIES, MID-2020
(continued)
Age groups
County of Karlovac
County of Varaždin
County of Koprivnica-Križevci
Total
Men
Women
Total
Men
Women
Total
Men
Women
Total
114 269
55 987
58 282
165 357
80 959
84 398
105 385
51 387
53 998
0 – 4
4 650
2 366
2 284
7 023
3 572
3 451
4 787
2 440
2 347
5 – 9
4 866
2 457
2 409
7 561
3 848
3 713
5 160
2 641
2 519
10 – 14
5 348
2 688
2 660
8 525
4 395
4 130
5 497
2 925
2 572
15 – 19
5 247
2 722
2 525
8 568
4 279
4 289
5 496
2 829
2 667
20 – 24
6 090
3 222
2 868
9 951
5 181
4 770
6 454
3 344
3 110
25 – 29
5 879
3 084
2 795
9 665
5 169
4 496
6 014
3 168
2 846
30 – 34
6 490
3 415
3 075
10 276
5 463
4 813
6 034
3 146
2 888
35 – 39
7 616
4 084
3 532
11 558
6 059
5 499
6 749
3 508
3 241
40 – 44
7 612
3 965
3 647
11 441
5 941
5 500
6 673
3 471
3 202
45 – 49
7 348
3 876
3 472
11 200
5 784
5 416
6 862
3 475
3 387
50 – 54
8 093
4 155
3 938
11 939
6 013
5 926
7 580
3 733
3 847
55 – 59
9 028
4 487
4 541
12 364
6 098
6 266
7 992
3 978
4 014
60 – 64
9 272
4 660
4 612
12 095
5 924
6 171
8 021
3 950
4 071
65 – 69
8 056
3 920
4 136
10 385
4 899
5 486
7 066
3 370
3 696
70 – 74
5 944
2 577
3 367
8 051
3 491
4 560
5 401
2 252
3 149
75 – 79
4 733
1 809
2 924
6 368
2 452
3 916
4 279
1 596
2 683
80 – 84
4 414
1 485
2 929
4 861
1 547
3 314
3 086
975
2 111
85 +
3 583
1 015
2 568
3 526
844
2 682
2 234
586
1 648
4 POPULATION ESTIMATE, BY SEX AND AGE GROUPS, BY COUNTIES, MID-2020
(continued)
Age groups
County of Bjelovar-Bilogora
County of Primorje-Gorski kotar
County of Lika-Senj
Total
Men
Women
Total
Men
Women
Total
Men
Women
Total
104 908
51 221
53 687
281 056
136 335
144 721
44 068
22 131
21 937
0 – 4
4 732
2 390
2 342
10 701
5 501
5 200
1 829
935
894
5 – 9
5 029
2 681
2 348
11 809
6 094
5 715
1 815
922
893
10 – 14
5 476
2 851
2 625
12 008
6 148
5 860
1 937
995
942
15 – 19
5 460
2 767
2 693
11 436
5 907
5 529
2 122
1 129
993
20 – 24
6 451
3 337
3 114
13 559
7 080
6 479
2 593
1 348
1 245
25 – 29
6 111
3 239
2 872
14 753
7 672
7 081
2 405
1 214
1 191
30 – 34
5 733
3 093
2 640
17 413
8 921
8 492
2 401
1 305
1 096
35 – 39
6 232
3 327
2 905
20 071
10 237
9 834
2 559
1 393
1 166
40 – 44
6 449
3 334
3 115
20 578
10 735
9 843
2 651
1 384
1 267
45 – 49
6 623
3 355
3 268
18 762
9 484
9 278
2 706
1 506
1 200
50 – 54
7 120
3 557
3 563
18 632
9 107
9 525
3 088
1 647
1 441
55 – 59
7 927
3 865
4 062
20 319
9 664
10 655
3 390
1 785
1 605
60 – 64
8 410
4 050
4 360
22 153
10 332
11 821
3 426
1 801
1 625
65 – 69
7 474
3 568
3 906
22 172
10 422
11 750
3 027
1 541
1 486
70 – 74
5 647
2 445
3 202
17 434
7 810
9 624
2 388
1 060
1 328
75 – 79
4 131
1 553
2 578
11 522
4 839
6 683
2 168
890
1 278
80 – 84
3 431
1 096
2 335
10 076
3 900
6 176
2 039
753
1 286
85 +
2 472
713
1 759
7 658
2 482
5 176
1 524
523
1 001
4 POPULATION ESTIMATE, BY SEX AND AGE GROUPS, BY COUNTIES, MID-2020
(continued)
Age groups
County of Virovitica-Podravina
County of Požega-Slavonia
County of Slavonski Brod-Posavina
Total
Men
Women
Total
Men
Women
Total
Men
Women
Total
72 378
35 041
37 337
65 134
31 973
33 161
135 483
66 417
69 066
0 – 4
3 242
1 655
1 587
2 923
1 509
1 414
5 948
3 115
2 833
5 – 9
3 463
1 789
1 674
3 080
1 616
1 464
6 561
3 433
3 128
10 – 14
3 714
1 918
1 796
3 513
1 857
1 656
7 316
3 803
3 513
15 – 19
3 891
1 986
1 905
3 586
1 840
1 746
7 783
4 077
3 706
20 – 24
4 688
2 419
2 269
4 710
2 434
2 276
9 561
5 024
4 537
25 – 29
4 303
2 218
2 085
3 905
2 050
1 855
8 359
4 510
3 849
30 – 34
3 866
2 042
1 824
3 330
1 811
1 519
7 558
4 019
3 539
35 – 39
4 378
2 267
2 111
3 692
1 878
1 814
7 501
4 037
3 464
40 – 44
4 462
2 259
2 203
3 722
1 893
1 829
7 928
3 991
3 937
45 – 49
4 418
2 175
2 243
4 016
2 095
1 921
8 456
4 281
4 175
50 – 54
5 289
2 627
2 662
4 561
2 284
2 277
9 409
4 710
4 699
55 – 59
5 886
2 913
2 973
4 907
2 478
2 429
10 483
5 125
5 358
60 – 64
5 857
2 805
3 052
5 010
2 493
2 517
10 302
5 011
5 291
65 – 69
4 842
2 332
2 510
4 454
2 151
2 303
8 803
4 176
4 627
70 – 74
3 566
1 517
2 049
3 212
1 377
1 835
6 630
2 791
3 839
75 – 79
2 876
1 017
1 859
2 737
1 001
1 736
5 465
2 045
3 420
80 – 84
2 164
707
1 457
2 273
769
1 504
4 409
1 467
2 942
85 +
1 473
395
1 078
1 503
437
1 066
3 011
802
2 209
4 POPULATION ESTIMATE, BY SEX AND AGE GROUPS, BY COUNTIES, MID-2020
(continued)
Age groups
County of Zadar
County of Osijek-Baranja
County of Šibenik-Knin
Total
Men
Women
Total
Men
Women
Total
Men
Women
Total
167 914
83 127
84 787
269 511
130 230
139 281
98 453
48 770
49 683
0 – 4
7 718
4 012
3 706
11 424
5 878
5 546
4 005
2 046
1 959
5 – 9
8 295
4 266
4 029
12 632
6 487
6 145
4 380
2 261
2 119
10 – 14
8 680
4 423
4 257
13 337
6 752
6 585
4 486
2 285
2 201
15 – 19
8 435
4 281
4 154
13 823
7 141
6 682
4 620
2 419
2 201
20 – 24
10 115
5 279
4 836
16 832
8 681
8 151
5 901
3 087
2 814
25 – 29
10 260
5 312
4 948
16 424
8 604
7 820
5 634
2 945
2 689
30 – 34
9 911
5 104
4 807
16 460
8 529
7 931
5 292
2 824
2 468
35 – 39
10 913
5 576
5 337
17 485
9 014
8 471
5 573
2 939
2 634
40 – 44
11 046
5 520
5 526
17 127
8 676
8 451
5 924
3 089
2 835
45 – 49
10 567
5 399
5 168
16 916
8 485
8 431
5 933
3 116
2 817
50 – 54
11 003
5 553
5 450
19 178
9 361
9 817
6 318
3 138
3 180
55 – 59
10 904
5 390
5 514
21 236
10 241
10 995
6 937
3 470
3 467
60 – 64
11 615
5.853
5 762
21 118
10 173
10 945
7 521
3 765
3 756
65 – 69
11 366
5.586
5 780
18 247
8 587
9 660
7 388
3 651
3 737
70 – 74
9 993
4.639
5 354
13 441
5 586
7 855
6 324
2 963
3 361
75 – 79
7 139
3 182
3 957
10 471
3 935
6 536
4 328
1 885
2 443
80 – 84
5 775
2 344
3 431
8 108
2 717
5 391
4 514
1 706
2 808
85 +
4 179
1 408
2 771
5 252
1 383
3 869
3 375
1 181
2 194
4 POPULATION ESTIMATE, BY SEX AND AGE GROUPS, BY COUNTIES, MID-2020
(continued)
Age groups
County of Vukovar-Sirmium
County of Split-Dalmatia
County of Istria
Total
Men
Women
Total
Men
Women
Total
Men
Women
Total
148 389
72 097
76 292
447 440
219 386
228 054
210 083
103 831
106 252
0 – 4
6 421
3 272
3 149
20 440
10 526
9 914
8 321
4 286
4 035
5 – 9
7 192
3 757
3 435
22 006
11 441
10 565
9 135
4 795
4 340
10 – 14
8 014
4 064
3 950
23 300
11 875
11 425
9 686
5 014
4 672
15 – 19
8 603
4 457
4 146
23 295
11 964
11 331
8 683
4 563
4 120
20 – 24
10 142
5 185
4 957
27 531
14 182
13 349
10 186
5 373
4 813
25 – 29
8 560
4 566
3 994
28 249
14 617
13 632
11 216
5 831
5 385
30 – 34
8 185
4 374
3 811
28 343
14 603
13 740
13 573
7 180
6 393
35 – 39
8 598
4 492
4 106
29 875
15 272
14 603
15 529
8 140
7 389
40 – 44
8 708
4 390
4 318
29 974
15 364
14 610
15 761
8 347
7 414
45 – 49
9 239
4 731
4 508
29 765
15 163
14 602
13 822
7 254
6 568
50 – 54
10 398
5 276
5 122
29 930
14 922
15 008
14 149
6 971
7 178
55 – 59
11 344
5 561
5 783
30 972
15 131
15 841
15 808
7 767
8 041
60 – 64
11 343
5 467
5 876
31 664
15 213
16 451
16 374
7 863
8 511
65 – 69
9 901
4 571
5 330
28 470
13 433
15 037
15 351
7 288
8 063
70 – 74
7 722
3 186
4 536
23 720
10 300
13 420
11 492
5 328
6 164
75 – 79
5 806
2 187
3 619
15 318
6 401
8 917
8 167
3 467
4 700
80 – 84
4 947
1 642
3 305
14 078
5 571
8 507
7 256
2 720
4 536
85 +
3 266
919
2 347
10 510
3 408
7 102
5 574
1 644
3 930
4 POPULATION ESTIMATE, BY SEX AND AGE GROUPS, BY COUNTIES, MID-2020
(continued)
Age groups
County of Dubrovnik-Neretva
County of Međimurje
City of Zagreb
Total
Men
Women
Total
Men
Women
Total
Men
Women
Total
122 571
60 568
62 003
108 822
53 445
55 377
809 268
382 337
426 931
0 – 4
6 016
2 999
3 017
5 778
2 964
2 814
40 901
20 959
19 942
5 – 9
6 265
3 270
2 995
5 790
3 031
2 759
42 166
21 788
20 378
10 – 14
6 221
3 216
3 005
5 917
3 047
2 870
39 083
19 950
19 133
15 – 19
5 779
2 950
2 829
6 144
3 185
2 959
34 947
18 016
16 931
20 – 24
7 305
3 820
3 485
6 648
3 414
3 234
42 769
22 229
20 540
25 – 29
7 701
4 026
3 675
6 307
3 385
2 922
48 934
24 631
24 303
30 – 34
7 669
4 000
3 669
6 670
3 471
3 199
58 235
28 311
29 924
35 – 39
7 982
4 101
3 881
7 257
3 805
3 452
67 357
33 371
33 986
40 – 44
8 335
4 441
3 894
7 286
3 700
3 586
63 492
31 535
31 957
45 – 49
7 721
4 050
3 671
6 979
3 512
3 467
57 315
28 128
29 187
50 – 54
8 034
4 037
3 997
7 305
3 598
3 707
53 322
25 650
27 672
55 – 59
8 203
3 964
4 239
7 762
3 817
3 945
50 429
23 293
27 136
60 – 64
8 568
4 186
4 382
7 918
3 897
4 021
51 118
22 357
28 761
65 – 69
8 141
3 873
4 268
6 856
3 399
3 457
48 588
20 858
27 730
70 – 74
6 495
2 911
3 584
4 866
2 145
2 721
38 702
15 420
23 282
75 – 79
4 466
1 903
2 563
4 089
1 651
2 438
30 458
11 536
18 922
80 – 84
4 167
1 699
2 468
2 991
892
2 099
23 577
8 821
14 756
85 +
3 503
1 122
2 381
2 259
532
1 727
17 875
5 484
12 391
NOTES ON METHODOLOGY
Data sources
The following surveys are the data sources for the population estimate of the Republic of Croatia:
- 2011 Census of Population, Households and Dwellings
- birth statistics
- death statistics
- statistics of the internal migration of population
- statistics of the international migration of population.
Population estimate is done on the basis of the census data collected in the 2011 Census of Population, Households and Dwellings.
The data on births are collected through the Statistical Report on Births (DEM-1) for every entry in the State birth register.
The data on deaths are collected through the Statistical Report on Deaths (DEM-2) for every entry in the State death register.
The surveys on the internal and international migration of population are based on data collected by the Ministry of the Interior.
Coverage
The population estimate data published in this First Release encompasses all persons included in the total population of the Republic of Croatia in the 2011 Census of Population, Households and Dwellings, all who were born and entered into the State birth register in the period from 1 April 2011 to the estimate date, all persons who died and were entered into the State death register in the period from 1 April 2011 to the estimate date and all persons who immigrated from abroad or emigrated to abroad, as well as persons who migrated inside the territory of the Republic of Croatia in the period from 1 April 2011 to the estimate date.
Definitions and explanations
Population estimate is calculated on the basis of the 2011 Census, natural change and net migration data.
In the 2011 Censusof Population, Households and Dwellings, according to the international statistical standards, the concept of the place of usual residence is used in defining the total population. The place of usual residence is considered a place where a person spends most of his/her daily time, irrespective of a short-term absence from it (e.g. due to going on a vacation, trip, medical treatment, visit etc.). In line with the definition of the place of usual residence, the total population includes the following persons:
- those who have lived in their place of usual residence for a continuous period of at least 12 months before the census moment
- those who arrived in their place of usual residence during the 12 months before the census moment with the intention of staying there for at least one year.
A live born child(live birth) is every child who at birth exhibits signs of life, such as breathing, beating of the heart, pulsation of the umbilical cord or definite movements of voluntary muscles.
A deceased person (death) is every live born person in whom there is a permanent disappearance of all evidence of life.
Natural increase is the difference between the number of live births and the number of deaths.
Data by age are expressed by completed years of age on the referent date. The data by age groups include persons who reached the age within the limits of an interval.
Average age indicates the mean age of the total population and it is calculated as the arithmetic mean of the age of the total population.
Ageing index represents the ratio of the population, that is, the share (%) of inhabitants aged 60 and over in the number of inhabitants aged from 0 to 19 inclusive.
Fertile female population includes women between 15 and 49 years of age.
Place of permanent residence, according to Article 2 of the Permanent Residence Act (NN, Nos 144/12 and 158/13) is "a place and address in the Republic of Croatia where a person settled with an intention of staying permanently in order to exercise their rights and commitments related to life interests such as family, professional, economic, social, cultural and other interests".
Immigrated or emigrated population is the population that changed their place of usual residence on the territory of the Republic of Croatia or that changed their country of usual residence for a period that is, or is expected to be, of at least one year.
Net migration of population (migration balance) is the difference between the number of immigrants and the number of emigrants of a particular area or country in a given period of time.
Territorial constitution
The data are presented by territorial constitution according to the Act on Territories of Counties, Towns and Municipalities in the Republic of Croatia (NN, No. 86/06), with the situation as on 31 December 2020.
Abbreviations
NN
Narodne novine, official gazette of the Republic of Croatia
'000
thousand
Published by the Croatian Bureau of Statistics, Zagreb, Ilica 3, P. O. B. 80. Phone: (+385 1) 4806-111, Fax: (+385 1) 4817-666 Press corner: press@dzs.hr
Persons responsible: Dubravka Rogić-Hadžalić, Director of Demographic and Social Statistics Directorate Lidija Brković, Director General
Prepared by: Tatjana Radić and Andrea Zebec
USERS ARE KINDLY REQUESTED TO STATE THE SOURCE.
Customer Relations and Data Protection Department
Information and user requests Phone: (+385 1) 4806-138, 4806-154 E-mail: stat.info@dzs.hr Fax: (+385 1) 4806-148