First Release
Year: LX.
Zagreb, 08 September 2023
STAN-2023-3-1
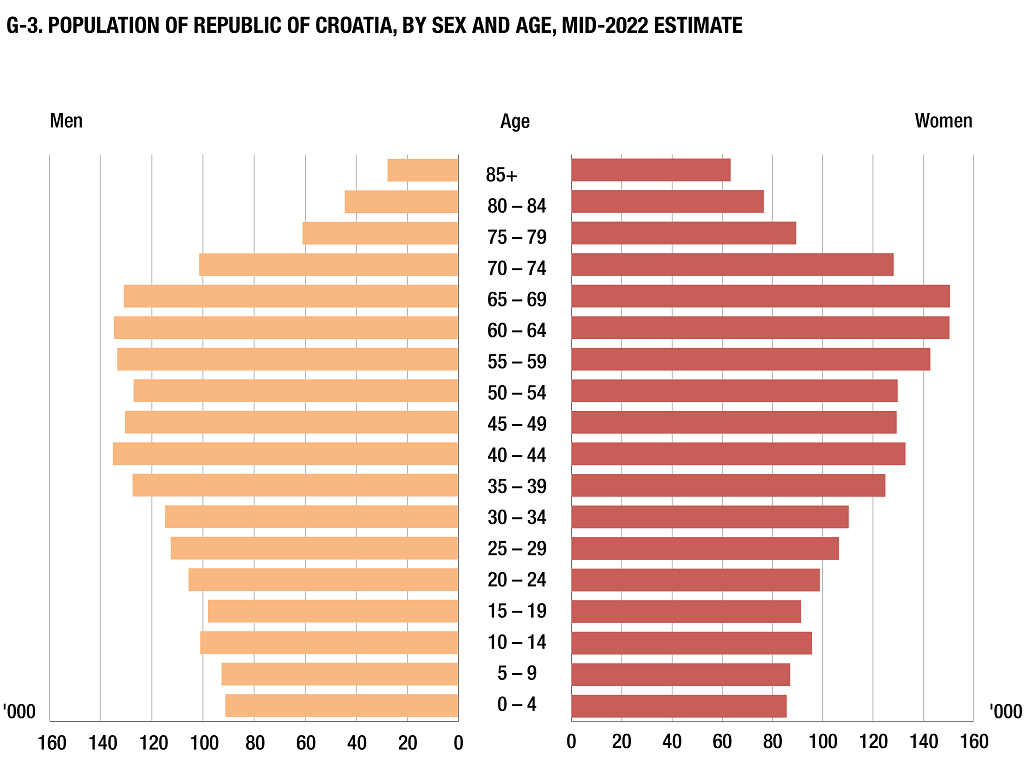
POPULATION ESTIMATE OF THE REPUBLIC OF CROATIA, 2022
According to the mid-2022 population estimate, the Republic of Croatia had 3 855 641 inhabitants, out of which there were 1 860 511 men and 1 995 130 women.
As compared to the previous year estimate, the population decreased by 23 340 persons or 0.6%.
An increase in the total population was recorded in the County of Zagreb, where, as compared to the previous year estimate, a relative increase of 0.47% was recorded, in the County of Istria (0.33%), and the County of Zadar (0.10%). The decrease in the total population was recorded in all other counties, and the highest relative decrease in the population was recorded in the County of Požega-Slavonia (2.09%), the County of Slavonski Brod-Posavina (1.95%), the County of Virovitica-Podravina (1.92%) and in the County of Vukovar-Sirmium (1.85%).
The share of women in the total population of the Republic of Croatia was 51.7%, while the share of men was 48.3%. Such a ratio was recorded in most counties. The lowest share of female population was recorded in the County of Lika-Senj (50.5%), while the largest share was recorded in the City of Zagreb (53.1%).
In 2022, the continuous ageing of the population kept on. The average age of the total population of the Republic of Croatia was 44.3 years (men 42.6, women 46.0), which places it among the oldest nations in Europe.
The share of youth (0 – 19 years of age) in the total population of the Republic of Croatia amounted to 19.2%. At the county level, the lowest share of youth was in the County of Primorje-Gorski kotar (16.7%) and the highest was in the County of Međimurje (21.5%).
The share of the fertile contingent in the total female population continued to decrease. Therefore, in 2022, it amounted to 39.8%.
As compared to the total population, the largest number of persons aged 65 and over was recorded in the County of Šibenik-Knin (27.6%) and the County of Lika-Senj (26.1%), while the smallest number was recorded in the City of Zagreb (20.7%) and in the County of Međimurje (20.8%).
In the Republic of Croatia, 52.2% of the population lived in only five counties, most of them in the City of Zagreb (767 445 or 19.9%) and the County of Split-Dalmatia (423 400 or 11.0%), while the least populated counties were the County of Lika-Senj (42 578 or 1.1%) and the County of Požega-Slavonia (63 037 or 1.6%).
1 MID-YEAR TOTAL POPULATION ESTIMATE OF THE REPUBLIC OF CROATIA, BY COUNTIES, 2018 – 2022
|
| County of |
20181) |
20191) |
20201) |
20212) |
20222) |
| Republic of Croatia |
4 087 843 |
4 065 253 |
4 047 680 |
3 878 981 |
3 855 641 |
| Zagreb |
309 469 |
309 169 |
309 463 |
299 983 |
301 387 |
| Krapina-Zagorje |
125 357 |
124 517 |
124 110 |
120 670 |
119 862 |
| Sisak-Moslavina |
148 589 |
145 904 |
143 618 |
140 131 |
137 603 |
| Karlovac |
116 829 |
115 484 |
114 269 |
112 357 |
110 938 |
| Varaždin |
166 982 |
166 112 |
165 357 |
159 747 |
158 594 |
| Koprivnica-Križevci |
107 711 |
106 367 |
105 385 |
101 358 |
100 366 |
| Bjelovar-Bilogora |
107 909 |
106 258 |
104 908 |
102 205 |
100 397 |
| Primorje-Gorski kotar |
284 239 |
282 730 |
281 056 |
266 183 |
264 267 |
| Lika-Senj |
45 184 |
44 625 |
44 068 |
42 931 |
42 578 |
| Virovitica-Podravina |
75 257 |
73 641 |
72 378 |
70 648 |
69 290 |
| Požega-Slavonia |
67 862 |
66 256 |
65 134 |
64 384 |
63 037 |
| Slavonski Brod-Posavina |
140 072 |
137 487 |
135 483 |
130 844 |
128 288 |
| Zadar |
168 153 |
168 213 |
167 914 |
160 085 |
160 239 |
| Osijek-Baranja |
277 227 |
272 673 |
269 511 |
258 719 |
255 175 |
| Šibenik-Knin |
100 153 |
99 210 |
98 453 |
96 722 |
95 719 |
| Vukovar-Sirmium |
154 371 |
150 985 |
148 389 |
143 678 |
141 025 |
| Split-Dalmatia |
448 071 |
447 747 |
447 440 |
423 849 |
423 400 |
| Istria |
208 765 |
209 573 |
210 083 |
195 326 |
195 970 |
| Dubrovnik-Neretva |
121 215 |
121 816 |
122 571 |
115 714 |
115 049 |
| Međimurje |
109 921 |
109 232 |
108 822 |
105 393 |
105 012 |
| City of Zagreb |
804 507 |
807 254 |
809 268 |
768 054 |
767 445 |
|
G-1 SHARE OF POPULATION IN COUNTIES IN TOTAL POPULATION OF THE REPUBLIC OF CROATIA, MID-2022 ESTIMATE
Source: Croatian Bureau of Statistics
2 AVERAGE AGE, AGEING INDEX AND FERTILE CONTINGENT OF POPULATION OF THE REPUBLIC OF CROATIA
|
| |
Average age |
Ageing index, % |
Fertile contingent, 15 – 49, % |
| Total |
Men |
Women |
Total |
Men |
Women |
Women |
| 1971 |
34,0 |
32,4 |
35,5 |
47,2 |
38,5 |
56,2 |
51,4 |
| 1981 |
35,4 |
33,8 |
37,1 |
52,6 |
40,4 |
65,3 |
48,5 |
| 1991 |
37,1 |
35,4 |
38,7 |
66,7 |
50,8 |
83,3 |
46,6 |
| 2001 |
39,3 |
37,5 |
41,0 |
90,7 |
71,6 |
110,8 |
46,9 |
| 2002 |
39,6 |
37,8 |
41,3 |
93,8 |
74,1 |
114,3 |
47,1 |
| 2003 |
39,9 |
38,1 |
41,5 |
96,2 |
76,1 |
117,2 |
46,9 |
| 2004 |
40,1 |
38,3 |
41,8 |
98,4 |
77,8 |
119,9 |
46,7 |
| 2005 |
40,3 |
38,5 |
42,0 |
99,6 |
78,7 |
121,5 |
46,4 |
| 2006 |
40,5 |
38,8 |
42,2 |
100,5 |
79,4 |
122,6 |
46,1 |
| 2007 |
40,8 |
39,0 |
42,4 |
103,1 |
81,7 |
125,5 |
45,8 |
| 2008 |
41,0 |
39,2 |
42,6 |
105,2 |
83,6 |
127,8 |
45,6 |
| 2009 |
41,1 |
39,4 |
42,8 |
107,6 |
85,8 |
130,4 |
45,3 |
| 2010 |
41,3 |
39,5 |
43,0 |
110,3 |
88,5 |
133,3 |
45,0 |
| 2011 |
41,8 |
40,0 |
43,5 |
115,7 |
92,9 |
139,7 |
43,8 |
| 2012 |
42,0 |
40,2 |
43,7 |
117,8 |
95,1 |
141,7 |
43,6 |
| 2013 |
42,2 |
40,3 |
43,9 |
121,0 |
98,0 |
145,2 |
43,4 |
| 2014 |
42,4 |
40,5 |
44,1 |
123,9 |
100,8 |
148,4 |
43,1 |
| 2015 |
42,6 |
40,7 |
44,3 |
127,5 |
104,1 |
152,2 |
42,8 |
| 2016 |
42,8 |
41,0 |
44,5 |
132,0 |
108,2 |
157,0 |
42,4 |
| 2017 |
43,1 |
41,3 |
44,8 |
136,9 |
112,8 |
162,3 |
41,9 |
| 2018 |
43,4 |
41,5 |
45,0 |
141,4 |
116,7 |
167,5 |
41,5 |
| 2019 |
43,6 |
41,8 |
45,3 |
145,4 |
120,5 |
171,8 |
41,1 |
| 2020 |
43,8 |
42,0 |
45,5 |
149,3 |
124,1 |
176,0 |
40,8 |
| 2021 |
44,3 |
42,5 |
45,9 |
155,6 |
130,2 |
182,5 |
40,0 |
| 2022 |
44,3 |
42,6 |
46,0 |
156,1 |
130,6 |
183,1 |
39,8 |
|
G-2 SHARE OF POPULATION AGED 65 AND OVER IN TOTAL POPULATION, BY COUNTIES, MID-2022 ESTIMATE
Source: Croatian Bureau of Statistics
3 POPULATION ESTIMATE OF THE REPUBLIC OF CROATIA, BY SEX AND SINGLE AGE, MID-2022
|
| |
|
|
|
|
(continued) |
|
|
|
| Age |
Total |
Men |
Women |
|
Age |
Total |
Men |
Women |
| Total |
3 855 641 |
1 860 511 |
1 995 130 |
|
|
|
|
|
| 0 |
35 441 |
18 163 |
17 278 |
|
43 |
54 086 |
27 248 |
26 838 |
| 1 |
35 268 |
18 316 |
16 952 |
|
44 |
53 196 |
26 640 |
26 556 |
| 2 |
35 123 |
18 009 |
17 114 |
|
45 |
52 399 |
26 314 |
26 085 |
| 3 |
35 384 |
17 980 |
17 404 |
|
46 |
52 401 |
26 186 |
26 215 |
| 4 |
35 190 |
18 275 |
16 915 |
|
47 |
51 707 |
25 937 |
25 770 |
| 5 |
35 246 |
17 998 |
17 248 |
|
48 |
51 488 |
25 718 |
25 770 |
| 6 |
34 439 |
17 525 |
16 914 |
|
49 |
51 381 |
25 761 |
25 620 |
| 7 |
35 883 |
18 430 |
17 453 |
|
50 |
52 177 |
25 951 |
26 226 |
| 8 |
36 554 |
18 831 |
17 723 |
|
51 |
49 331 |
24 478 |
24 853 |
| 9 |
37 210 |
19 398 |
17 812 |
|
52 |
50 043 |
24 675 |
25 368 |
| 10 |
38 009 |
19 427 |
18 582 |
|
53 |
51 575 |
25 293 |
26 282 |
| 11 |
38 310 |
19 764 |
18 546 |
|
54 |
53 253 |
26 119 |
27 134 |
| 12 |
40 692 |
20 825 |
19 867 |
|
55 |
55 257 |
26 806 |
28 451 |
| 13 |
39 739 |
20 268 |
19 471 |
|
56 |
56 345 |
27 228 |
29 117 |
| 14 |
39 570 |
20 223 |
19 347 |
|
57 |
54 998 |
26 476 |
28 522 |
| 15 |
37 445 |
19 319 |
18 126 |
|
58 |
53 556 |
25 892 |
27 664 |
| 16 |
38 204 |
19 651 |
18 553 |
|
59 |
55 609 |
26 455 |
29 154 |
| 17 |
39 378 |
20 361 |
19 017 |
|
60 |
56 733 |
26 853 |
29 880 |
| 18 |
36 914 |
18 984 |
17 930 |
|
61 |
56 781 |
26 814 |
29 967 |
| 19 |
37 046 |
19 232 |
17 814 |
|
62 |
57 859 |
27 394 |
30 465 |
| 20 |
37 929 |
19 590 |
18 339 |
|
63 |
57 405 |
27 112 |
30 293 |
| 21 |
39 120 |
20 243 |
18 877 |
|
64 |
55 950 |
26 043 |
29 907 |
| 22 |
41 022 |
21 148 |
19 874 |
|
65 |
57 391 |
26 786 |
30 605 |
| 23 |
41 864 |
21 590 |
20 274 |
|
66 |
57 543 |
26 777 |
30 766 |
| 24 |
44 081 |
22 564 |
21 517 |
|
67 |
58 290 |
27 189 |
31 101 |
| 25 |
45 982 |
23 690 |
22 292 |
|
68 |
53 446 |
24 668 |
28 778 |
| 26 |
44 429 |
22 901 |
21 528 |
|
69 |
54 336 |
24 835 |
29 501 |
| 27 |
42 720 |
21 830 |
20 890 |
|
70 |
48 757 |
22 104 |
26 653 |
| 28 |
42 302 |
21 518 |
20 784 |
|
71 |
47 886 |
21 431 |
26 455 |
| 29 |
43 033 |
22 069 |
20 964 |
|
72 |
48 078 |
21 294 |
26 784 |
| 30 |
42 593 |
21 965 |
20 628 |
|
73 |
44 544 |
19 174 |
25 370 |
| 31 |
44 687 |
22 771 |
21 916 |
|
74 |
39 930 |
16 902 |
23 028 |
| 32 |
44 200 |
22 413 |
21 787 |
|
75 |
40 521 |
17 035 |
23 486 |
| 33 |
45 656 |
23 022 |
22 634 |
|
76 |
27 151 |
11 121 |
16 030 |
| 34 |
47 440 |
24 010 |
23 430 |
|
77 |
26 240 |
10 615 |
15 625 |
| 35 |
47 320 |
23 865 |
23 455 |
|
78 |
27 870 |
10 889 |
16 981 |
| 36 |
48 492 |
24 213 |
24 279 |
|
79 |
28 328 |
10 910 |
17 418 |
| 37 |
51 214 |
25 747 |
25 467 |
|
80 |
27 735 |
10 600 |
17 135 |
| 38 |
52 711 |
26 765 |
25 946 |
|
81 |
25 975 |
9 749 |
16 226 |
| 39 |
52 122 |
26 263 |
25 859 |
|
82 |
24 950 |
9 054 |
15 896 |
| 40 |
52 767 |
26 576 |
26 191 |
|
83 |
21 808 |
7 727 |
14 081 |
| 41 |
53 528 |
26 992 |
26 536 |
|
84 |
20 217 |
6 953 |
13 264 |
| 42 |
53 984 |
27 150 |
26 834 |
|
85 + |
90 874 |
27 431 |
63 443 |
|
4 POPULATION ESTIMATE, BY SEX AND AGE GROUPS, BY COUNTIES, MID-2022
|
| Age groups |
Republic of Croatia |
County of Zagreb |
County of Krapina-Zagorje |
County of Sisak-Moslavina |
| Total |
Men |
Women |
Total |
Men |
Women |
Total |
Men |
Women |
Total |
Men |
Women |
| Total |
3 855 641 |
1 860 511 |
1 995 130 |
301 387 |
146 467 |
154 920 |
119 862 |
58 398 |
61 464 |
137 603 |
67 211 |
70 392 |
| 0 – 4 |
176 406 |
90 743 |
85 663 |
14 114 |
7 190 |
6 924 |
5 293 |
2 686 |
2 607 |
5 601 |
2 930 |
2 671 |
| 5 – 9 |
179 332 |
92 182 |
87 150 |
14 482 |
7 374 |
7 108 |
5 340 |
2 751 |
2 589 |
5 814 |
2 974 |
2 840 |
| 10 – 14 |
196 320 |
100 507 |
95 813 |
16 250 |
8 363 |
7 887 |
5 926 |
3 039 |
2 887 |
6 590 |
3 282 |
3 308 |
| 15 – 19 |
188 987 |
97 547 |
91 440 |
15 766 |
8 193 |
7 573 |
5 977 |
3 089 |
2 888 |
6 619 |
3 362 |
3 257 |
| 20 – 24 |
204 016 |
105 135 |
98 881 |
16 474 |
8 469 |
8 005 |
6 689 |
3 389 |
3 300 |
7 383 |
3 859 |
3 524 |
| 25 – 29 |
218 466 |
112 008 |
106 458 |
17 014 |
8 820 |
8 194 |
6 998 |
3 611 |
3 387 |
7 108 |
3 832 |
3 276 |
| 30 – 34 |
224 576 |
114 181 |
110 395 |
17 388 |
8 900 |
8 488 |
7 294 |
3 808 |
3 486 |
6 801 |
3 612 |
3 189 |
| 35 – 39 |
251 859 |
126 853 |
125 006 |
19 975 |
10 118 |
9 857 |
7 794 |
3 987 |
3 807 |
8 080 |
4 248 |
3 832 |
| 40 – 44 |
267 561 |
134 606 |
132 955 |
21 962 |
11 211 |
10 751 |
7 956 |
4 104 |
3 852 |
8 740 |
4 498 |
4 242 |
| 45 – 49 |
259 376 |
129 916 |
129 460 |
21 490 |
10 883 |
10 607 |
8 131 |
4 101 |
4 030 |
9 131 |
4 718 |
4 413 |
| 50 – 54 |
256 379 |
126 516 |
129 863 |
20 237 |
10 182 |
10 055 |
8 634 |
4 385 |
4 249 |
9 414 |
4 776 |
4 638 |
| 55 – 59 |
275 765 |
132 857 |
142 908 |
20 669 |
10 005 |
10 664 |
9 612 |
4 788 |
4 824 |
10 727 |
5 375 |
5 352 |
| 60 – 64 |
284 728 |
134 216 |
150 512 |
20 993 |
9 746 |
11 247 |
9 045 |
4 519 |
4 526 |
11 194 |
5 412 |
5 782 |
| 65 – 69 |
281 006 |
130 255 |
150 751 |
21 595 |
9 853 |
11 742 |
8 347 |
3 931 |
4 416 |
11 402 |
5 357 |
6 045 |
| 70 – 74 |
229 195 |
100 905 |
128 290 |
17 367 |
7 649 |
9 718 |
6 417 |
2 842 |
3 575 |
9 150 |
4 013 |
5 137 |
| 75 – 79 |
150 110 |
60 570 |
89 540 |
11 390 |
4 757 |
6 633 |
4 448 |
1 758 |
2 690 |
5 788 |
2 323 |
3 465 |
| 80 – 84 |
120 685 |
44 083 |
76 602 |
8 123 |
2 989 |
5 134 |
3 330 |
1 027 |
2 303 |
4 690 |
1 639 |
3 051 |
| 85 + |
90 874 |
27 431 |
63 443 |
6 098 |
1 765 |
4 333 |
2 631 |
583 |
2 048 |
3 371 |
1 001 |
2 370 |
|
4 POPULATION ESTIMATE, BY SEX AND AGE GROUPS, BY COUNTIES, MID-2022
|
| (continued) |
|
|
|
|
|
|
|
|
|
| Age groups |
County of Karlovac |
County of Varaždin |
County of Koprivnica-Križevci |
| Total |
Men |
Women |
Total |
Men |
Women |
Total |
Men |
Women |
| Total |
110 938 |
53 890 |
57 048 |
158 594 |
77 338 |
81 256 |
100 366 |
48 976 |
51 390 |
| 0 – 4 |
4 456 |
2 270 |
2 186 |
6 785 |
3 427 |
3 358 |
4 624 |
2 381 |
2 243 |
| 5 – 9 |
4 674 |
2 375 |
2 299 |
7 027 |
3 558 |
3 469 |
4 732 |
2 387 |
2 345 |
| 10 – 14 |
5 177 |
2 592 |
2 585 |
8 100 |
4 150 |
3 950 |
5 224 |
2 770 |
2 454 |
| 15 – 19 |
5 194 |
2 670 |
2 524 |
8 330 |
4 255 |
4 075 |
5 206 |
2 747 |
2 459 |
| 20 – 24 |
5 426 |
2 865 |
2 561 |
8 861 |
4 529 |
4 332 |
5 466 |
2 794 |
2 672 |
| 25 – 29 |
5 388 |
2 843 |
2 545 |
9 007 |
4 721 |
4 286 |
5 534 |
2 937 |
2 597 |
| 30 – 34 |
5 927 |
3 037 |
2 890 |
9 328 |
4 917 |
4 411 |
5 469 |
2 881 |
2 588 |
| 35 – 39 |
6 998 |
3 608 |
3 390 |
10 746 |
5 594 |
5 152 |
6 264 |
3 199 |
3 065 |
| 40 – 44 |
7 566 |
3 914 |
3 652 |
11 441 |
5 838 |
5 603 |
6 669 |
3 467 |
3 202 |
| 45 – 49 |
7 352 |
3 821 |
3 531 |
10 955 |
5 698 |
5 257 |
6 570 |
3 337 |
3 233 |
| 50 – 54 |
7 475 |
3 798 |
3 677 |
10 976 |
5 496 |
5 480 |
6 931 |
3 457 |
3 474 |
| 55 – 59 |
8 656 |
4 243 |
4 413 |
12 025 |
5 878 |
6 147 |
7 737 |
3 776 |
3 961 |
| 60 – 64 |
9 198 |
4 462 |
4 736 |
11 874 |
5 714 |
6 160 |
7 741 |
3 726 |
4 015 |
| 65 – 69 |
9 036 |
4 263 |
4 773 |
10 850 |
5 143 |
5 707 |
7 412 |
3 559 |
3 853 |
| 70 – 74 |
6 782 |
3 054 |
3 728 |
8 591 |
3 788 |
4 803 |
5 903 |
2 572 |
3 331 |
| 75 – 79 |
4 454 |
1 777 |
2 677 |
6 006 |
2 385 |
3 621 |
3 899 |
1 487 |
2 412 |
| 80 – 84 |
3 808 |
1 332 |
2 476 |
4 460 |
1 463 |
2 997 |
2 906 |
956 |
1 950 |
| 85 + |
3 371 |
966 |
2 405 |
3 232 |
784 |
2 448 |
2 079 |
543 |
1 536 |
|
4 POPULATION ESTIMATE, BY SEX AND AGE GROUPS, BY COUNTIES, MID-2022
|
| (continued) |
|
|
|
|
|
|
|
|
|
| Age groups |
County of Bjelovar-Bilogora |
County of Primorje-Gorski kotar |
County of Lika-Senj |
| Total |
Men |
Women |
Total |
Men |
Women |
Total |
Men |
Women |
| Total |
100 397 |
49 002 |
51 395 |
264 267 |
126 623 |
137 644 |
42 578 |
21 073 |
21 505 |
| 0 – 4 |
4 671 |
2 380 |
2 291 |
10 316 |
5 323 |
4 993 |
1 784 |
923 |
861 |
| 5 – 9 |
4 650 |
2 452 |
2 198 |
10 904 |
5 623 |
5 281 |
1 833 |
949 |
884 |
| 10 – 14 |
5 154 |
2 714 |
2 440 |
11 963 |
6 055 |
5 908 |
1 878 |
968 |
910 |
| 15 – 19 |
5 134 |
2 631 |
2 503 |
11 026 |
5 658 |
5 368 |
1 976 |
1 025 |
951 |
| 20 – 24 |
5 486 |
2 847 |
2 639 |
11 436 |
6 016 |
5 420 |
2 195 |
1 148 |
1 047 |
| 25 – 29 |
5 477 |
2 950 |
2 527 |
12 940 |
6 518 |
6 422 |
2 267 |
1 162 |
1 105 |
| 30 – 34 |
5 189 |
2 714 |
2 475 |
14 736 |
7 395 |
7 341 |
2 294 |
1 169 |
1 125 |
| 35 – 39 |
5 932 |
3 046 |
2 886 |
17 362 |
8 648 |
8 714 |
2 423 |
1 238 |
1 185 |
| 40 – 44 |
6 264 |
3 276 |
2 988 |
19 643 |
10 036 |
9 607 |
2 561 |
1 285 |
1 276 |
| 45 – 49 |
6 431 |
3 290 |
3 141 |
18 460 |
9 231 |
9 229 |
2 624 |
1 378 |
1 246 |
| 50 – 54 |
6 662 |
3 298 |
3 364 |
17 424 |
8 495 |
8 929 |
2 917 |
1 535 |
1 382 |
| 55 – 59 |
7 668 |
3 770 |
3 898 |
18 654 |
8 759 |
9 895 |
3 376 |
1 746 |
1 630 |
| 60 – 64 |
8 069 |
3 867 |
4 202 |
20 776 |
9 609 |
11 167 |
3 345 |
1 721 |
1 624 |
| 65 – 69 |
7 951 |
3 756 |
4 195 |
21 556 |
9 948 |
11 608 |
3 377 |
1 711 |
1 666 |
| 70 – 74 |
6 398 |
2 843 |
3 555 |
18 858 |
8 397 |
10 461 |
2 576 |
1 177 |
1 399 |
| 75 – 79 |
3 918 |
1 515 |
2 403 |
11 486 |
4 889 |
6 597 |
1 805 |
752 |
1 053 |
| 80 – 84 |
3 021 |
998 |
2 023 |
9 347 |
3 593 |
5 754 |
1 814 |
688 |
1 126 |
| 85 + |
2 322 |
655 |
1 667 |
7 380 |
2 430 |
4 950 |
1 533 |
498 |
1 035 |
|
4 POPULATION ESTIMATE, BY SEX AND AGE GROUPS, BY COUNTIES, MID-2022
|
| (continued) |
|
|
|
|
|
|
|
|
|
| Age groups |
County of Virovitica-Podravina |
County of Požega-Slavonia |
County of Slavonski Brod-Posavina |
| Total |
Men |
Women |
Total |
Men |
Women |
Total |
Men |
Women |
| Total |
69 290 |
33 556 |
35 734 |
63 037 |
30 689 |
32 348 |
128 288 |
62 686 |
65 602 |
| 0 – 4 |
3 057 |
1 529 |
1 528 |
2 812 |
1 470 |
1 342 |
5 624 |
2 908 |
2 716 |
| 5 – 9 |
3 147 |
1 606 |
1 541 |
2 921 |
1 475 |
1 446 |
5 852 |
3 051 |
2 801 |
| 10 – 14 |
3 606 |
1 883 |
1 723 |
3 354 |
1 747 |
1 607 |
6 764 |
3 462 |
3 302 |
| 15 – 19 |
3 602 |
1 859 |
1 743 |
3 439 |
1 755 |
1 684 |
7 044 |
3 766 |
3 278 |
| 20 – 24 |
3 852 |
2 031 |
1 821 |
3 713 |
1 972 |
1 741 |
7 778 |
4 079 |
3 699 |
| 25 – 29 |
3 795 |
1 958 |
1 837 |
3 541 |
1 856 |
1 685 |
7 052 |
3 743 |
3 309 |
| 30 – 34 |
3 585 |
1 893 |
1 692 |
3 154 |
1 647 |
1 507 |
6 590 |
3 481 |
3 109 |
| 35 – 39 |
4 180 |
2 127 |
2 053 |
3 646 |
1 856 |
1 790 |
7 354 |
3 755 |
3 599 |
| 40 – 44 |
4 518 |
2 318 |
2 200 |
3 800 |
1 897 |
1 903 |
7 606 |
3 883 |
3 723 |
| 45 – 49 |
4 279 |
2 118 |
2 161 |
4 007 |
1 996 |
2 011 |
7 914 |
3 983 |
3 931 |
| 50 – 54 |
4 648 |
2 288 |
2 360 |
4 249 |
2 163 |
2 086 |
8 609 |
4 283 |
4 326 |
| 55 – 59 |
5 661 |
2 744 |
2 917 |
4 786 |
2 379 |
2 407 |
10 072 |
4 935 |
5 137 |
| 60 – 64 |
5 943 |
2 894 |
3 049 |
5 008 |
2 434 |
2 574 |
10 568 |
5 105 |
5 463 |
| 65 – 69 |
5 241 |
2 466 |
2 775 |
4 935 |
2 353 |
2 582 |
9 879 |
4 712 |
5 167 |
| 70 – 74 |
4 153 |
1 833 |
2 320 |
3 709 |
1 642 |
2 067 |
7 366 |
3 292 |
4 074 |
| 75 – 79 |
2 605 |
978 |
1 627 |
2 457 |
938 |
1 519 |
5 146 |
2 031 |
3 115 |
| 80 – 84 |
1 980 |
651 |
1 329 |
2 103 |
707 |
1 396 |
4 106 |
1 391 |
2 715 |
| 85 + |
1 438 |
380 |
1 058 |
1 403 |
402 |
1 001 |
2 964 |
826 |
2 138 |
|
4 POPULATION ESTIMATE, BY SEX AND AGE GROUPS, BY COUNTIES, MID-2022
|
| (continued) |
|
|
|
|
|
|
|
|
|
| Age groups |
County of Zadar |
County of Osijek-Baranja |
County of Šibenik-Knin |
| Total |
Men |
Women |
Total |
Men |
Women |
Total |
Men |
Women |
| Total |
160 239 |
78 458 |
81 781 |
255 175 |
122 906 |
132 269 |
95 719 |
47 112 |
48 607 |
| 0 – 4 |
7 492 |
3 880 |
3 612 |
11 130 |
5 766 |
5 364 |
3 829 |
1 965 |
1 864 |
| 5 – 9 |
7 675 |
3 979 |
3 696 |
11 565 |
5 957 |
5 608 |
4 026 |
2 081 |
1 945 |
| 10 – 14 |
8 307 |
4 247 |
4 060 |
12 497 |
6 284 |
6 213 |
4 422 |
2 203 |
2 219 |
| 15 – 19 |
7 895 |
4 038 |
3 857 |
12 766 |
6 547 |
6 219 |
4 380 |
2 267 |
2 113 |
| 20 – 24 |
8 667 |
4 439 |
4 228 |
14 295 |
7 319 |
6 976 |
4 961 |
2 606 |
2 355 |
| 25 – 29 |
9 247 |
4 654 |
4 593 |
14 641 |
7 704 |
6 937 |
4 903 |
2 530 |
2 373 |
| 30 – 34 |
8 983 |
4 560 |
4 423 |
14 254 |
7 371 |
6 883 |
4 852 |
2 479 |
2 373 |
| 35 – 39 |
9 839 |
4 855 |
4 984 |
16 200 |
8 285 |
7 915 |
5 493 |
2 810 |
2 683 |
| 40 – 44 |
10 591 |
5 326 |
5 265 |
16 549 |
8 286 |
8 263 |
5 891 |
3 018 |
2 873 |
| 45 – 49 |
10 590 |
5 207 |
5 383 |
16 126 |
8 007 |
8 119 |
5 914 |
3 058 |
2 856 |
| 50 – 54 |
10 160 |
5 066 |
5 094 |
17 227 |
8 379 |
8 848 |
6 135 |
3 075 |
3 060 |
| 55 – 59 |
10 786 |
5 259 |
5 527 |
20 115 |
9 623 |
10 492 |
6 890 |
3 397 |
3 493 |
| 60 – 64 |
11 374 |
5 583 |
5 791 |
20 720 |
9 892 |
10 828 |
7 610 |
3 706 |
3 904 |
| 65 – 69 |
11 791 |
5 696 |
6 095 |
19 999 |
9 358 |
10 641 |
7 989 |
3 958 |
4 031 |
| 70 – 74 |
10 449 |
4 978 |
5 471 |
14 795 |
6 428 |
8 367 |
6 834 |
3 254 |
3 580 |
| 75 – 79 |
7 008 |
3 118 |
3 890 |
9 717 |
3 726 |
5 991 |
4 226 |
1 927 |
2 299 |
| 80 – 84 |
5 440 |
2 242 |
3 198 |
7 510 |
2 589 |
4 921 |
4 212 |
1 695 |
2 517 |
| 85 + |
3 945 |
1 331 |
2 614 |
5 069 |
1 385 |
3 684 |
3 152 |
1 083 |
2 069 |
|
4 POPULATION ESTIMATE, BY SEX AND AGE GROUPS, BY COUNTIES, MID-2022
|
| (continued) |
|
|
|
|
|
|
|
|
|
| Age groups |
County of Vukovar-Sirmium |
County of Split-Dalmatia |
County of Istria |
| Total |
Men |
Women |
Total |
Men |
Women |
Total |
Men |
Women |
| Total |
141 025 |
68 352 |
72 673 |
423 400 |
205 457 |
217 943 |
195 970 |
94 845 |
101 125 |
| 0 – 4 |
6 079 |
3 170 |
2 909 |
20 022 |
10 305 |
9 717 |
8 206 |
4 176 |
4 030 |
| 5 – 9 |
6 516 |
3 391 |
3 125 |
20 090 |
10 394 |
9 696 |
8 500 |
4 417 |
4 083 |
| 10 – 14 |
7 348 |
3 765 |
3 583 |
22 596 |
11 537 |
11 059 |
9 383 |
4 891 |
4 492 |
| 15 – 19 |
7 940 |
4 039 |
3 901 |
22 210 |
11 426 |
10 784 |
8 479 |
4 437 |
4 042 |
| 20 – 24 |
8 220 |
4 323 |
3 897 |
24 121 |
12 229 |
11 892 |
8 538 |
4 400 |
4 138 |
| 25 – 29 |
7 552 |
3 960 |
3 592 |
25 245 |
12 723 |
12 522 |
9 549 |
4 833 |
4 716 |
| 30 – 34 |
7 080 |
3 680 |
3 400 |
25 535 |
12 881 |
12 654 |
11 524 |
5 881 |
5 643 |
| 35 – 39 |
8 286 |
4 255 |
4 031 |
27 139 |
13 710 |
13 429 |
13 410 |
6 652 |
6 758 |
| 40 – 44 |
8 321 |
4 133 |
4 188 |
28 136 |
14 032 |
14 104 |
14 530 |
7 409 |
7 121 |
| 45 – 49 |
8 987 |
4 647 |
4 340 |
28 107 |
14 068 |
14 039 |
13 244 |
6 698 |
6 546 |
| 50 – 54 |
9 477 |
4 765 |
4 712 |
28 090 |
13 894 |
14 196 |
12 683 |
6 171 |
6 512 |
| 55 – 59 |
11 028 |
5 388 |
5 640 |
28 785 |
13 967 |
14 818 |
14 485 |
6 880 |
7 605 |
| 60 – 64 |
11 476 |
5 531 |
5 945 |
30 450 |
14 414 |
16 036 |
15 719 |
7 465 |
8 254 |
| 65 – 69 |
11 033 |
5 106 |
5 927 |
29 590 |
13 875 |
15 715 |
15 404 |
7 211 |
8 193 |
| 70 – 74 |
8 551 |
3 707 |
4 844 |
24 891 |
11 147 |
13 744 |
12 701 |
5 821 |
6 880 |
| 75 – 79 |
5 516 |
2 115 |
3 401 |
15 281 |
6 451 |
8 830 |
7 479 |
3 235 |
4 244 |
| 80 – 84 |
4 472 |
1 495 |
2 977 |
13 265 |
5 206 |
8 059 |
6 799 |
2 623 |
4 176 |
| 85 + |
3 143 |
882 |
2 261 |
9 847 |
3 198 |
6 649 |
5 337 |
1 645 |
3 692 |
|
4 POPULATION ESTIMATE, BY SEX AND AGE GROUPS, BY COUNTIES, MID-2022
|
| (continued) |
|
|
|
|
|
|
|
|
|
| Age groups |
County of Dubrovnik-Neretva |
County of Međimurje |
City of Zagreb |
| Total |
Men |
Women |
Total |
Men |
Women |
Total |
Men |
Women |
| Total |
115 049 |
56 178 |
58 871 |
105 012 |
51 445 |
53 567 |
767 445 |
359 849 |
407 596 |
| 0 – 4 |
5 724 |
2 905 |
2 819 |
5 497 |
2 848 |
2 649 |
39 290 |
20 311 |
18 979 |
| 5 – 9 |
5 818 |
2 947 |
2 871 |
5 617 |
2 929 |
2 688 |
38 149 |
19 512 |
18 637 |
| 10 – 14 |
6 233 |
3 195 |
3 038 |
5 835 |
2 995 |
2 840 |
39 713 |
20 365 |
19 348 |
| 15 – 19 |
5 516 |
2 855 |
2 661 |
5 631 |
2 930 |
2 701 |
34 857 |
17 998 |
16 859 |
| 20 – 24 |
5 982 |
3 090 |
2 892 |
5 896 |
3 047 |
2 849 |
38 577 |
19 684 |
18 893 |
| 25 – 29 |
6 748 |
3 550 |
3 198 |
5 886 |
3 132 |
2 754 |
48 574 |
23 971 |
24 603 |
| 30 – 34 |
6 944 |
3 548 |
3 396 |
5 949 |
3 074 |
2 875 |
51 700 |
25 253 |
26 447 |
| 35 – 39 |
7 481 |
3 751 |
3 730 |
6 984 |
3 592 |
3 392 |
56 273 |
27 519 |
28 754 |
| 40 – 44 |
7 748 |
3 984 |
3 764 |
7 165 |
3 603 |
3 562 |
59 904 |
29 088 |
30 816 |
| 45 – 49 |
7 515 |
3 858 |
3 657 |
6 900 |
3 510 |
3 390 |
54 649 |
26 309 |
28 340 |
| 50 – 54 |
7 333 |
3 622 |
3 711 |
6 623 |
3 278 |
3 345 |
50 475 |
24 110 |
26 365 |
| 55 – 59 |
7 627 |
3 620 |
4 007 |
7 538 |
3 638 |
3 900 |
48 868 |
22 687 |
26 181 |
| 60 – 64 |
8 169 |
3 910 |
4 259 |
7 636 |
3 674 |
3 962 |
47 820 |
20 832 |
26 988 |
| 65 – 69 |
8 083 |
3 774 |
4 309 |
7 355 |
3 605 |
3 750 |
48 181 |
20 620 |
27 561 |
| 70 – 74 |
6 949 |
3 178 |
3 771 |
5 760 |
2 628 |
3 132 |
40 995 |
16 662 |
24 333 |
| 75 – 79 |
4 355 |
1 883 |
2 472 |
3 856 |
1 598 |
2 258 |
29 270 |
10 927 |
18 343 |
| 80 – 84 |
3 793 |
1 548 |
2 245 |
2 730 |
895 |
1 835 |
22 776 |
8 356 |
14 420 |
| 85 + |
3 031 |
960 |
2 071 |
2 154 |
469 |
1 685 |
17 374 |
5 645 |
11 729 |
|
NOTES ON METHODOLOGY
Data sources
The following surveys are the data sources for the population estimate of the Republic of Croatia:
- 2011 Census of Population, Households and Dwellings
- 2021 Census of Population, Households and Dwellings
- birth statistics
- death statistics
- statistics of the internal migration of population
- statistics of the international migration of population.
Population estimates for 2018, 2019 and 2020 have been done on the basis of the census data collected in the 2011 Census of Population, Households and Dwellings.
Population estimates for 2021 and 2022 have been done on the basis of the census data collected in the 2021 Census of Population, Households and Dwellings.
The data on births are collected through the Statistical Report on Births (DEM-1) for every entry in the State birth register.
The data on deaths are collected through the Statistical Report on Deaths (DEM-2) for every entry in the State death register.
The surveys on the internal and international migration of population are based on data collected by the Ministry of the Interior.
Coverage
The mid-2018, mid-2019 and mid-2020 population estimates data encompasses all persons included in the total population of the Republic of Croatia in the 2011 Census of Population, Households and Dwellings, all who were born and entered into the State birth register in the period from 1 April 2011 to the estimate date, all persons who died and were entered into the State death register in the period from 1 April 2011 to the estimate date and all persons who immigrated from abroad or emigrated abroad, as well as persons who migrated inside the territory of the Republic of Croatia in the period from 1 April 2011 to the estimate date.
The mid-2021 population estimate data encompasses all persons included in the total population of the Republic of Croatia in the 2021 Census of Population, Households and Dwellings, all who were born and entered into the State birth register in the period from the estimate date to 31 August 2021, all persons who died and were entered into the State death register in the period from the estimate date to 31 August 2021 and all persons who immigrated from abroad or emigrated abroad, as well as persons who migrated inside the territory of the Republic of Croatia in the period from the estimate date to 31 August 2021.
The mid-2022 population estimate data encompasses all persons included in the total population of the Republic of Croatia in the 2021 Census of Population, Households and Dwellings, all who were born and entered into the State birth register in the period from 1 September 2021 to the estimate date, all persons who died and were entered into the State death register in the period from 1 September 2021 to the estimate date and all persons who immigrated from abroad or emigrated abroad, as well as persons who migrated inside the territory of the Republic of Croatia in the period from 1 September 2021 to the estimate date.
Definitions and explanations
Mid-2018, mid-2019 and mid-2020 population estimates were calculated on the basis of the 2011 Census, natural change and net migration data.
Mid-2021 and mid-2022 population estimates were calculated on the basis of the 2021 Census, natural change and net migration data.
In the 2011 Census and 2021 Census, according to the international statistical standards, the concept of the place of usual residence is used in defining the total population. The place of usual residence is considered a place where a person spends most of his/her daily period of rest, irrespective of a short-term absence from it (e.g. due to going on a vacation, trip, medical treatment, visit etc.). In line with the definition of the place of usual residence, the total population includes the following persons:
- those who have lived in their place of usual residence for a continuous period of at least 12 months before the Census reference time
- those who arrived in their place of usual residence during the 12 months before the Census reference time with the intention of staying there for at least one year.
A live born child (live birth) is every child who at birth exhibits signs of life, such as breathing, beating of the heart, pulsation of the umbilical cord or definite movements of voluntary muscles.
A deceased person (death) is every live born person in whom there is a permanent disappearance of all evidence of life.
Natural increase is the difference between the number of live births and the number of deaths.
Data by age are expressed by completed years of age on the reference date. The data by age groups include persons who reached the age within the limits of an interval.
Average age indicates the mean age of the total population and it is calculated as the arithmetic mean of the age of the total population.
Ageing index represents the ratio of the population, that is, the share (%) of inhabitants aged 60 and over in the number of inhabitants aged from 0 to 19 inclusive.
Fertile female population includes women between 15 and 49 years of age.
Place of permanent residence, according to Article 2 of the Permanent Residence Act (NN, Nos 144/12 and 158/13) is "a place and address in the Republic of Croatia where a person has settled with an intention of staying permanently in order to exercise his or her rights and commitments related to life interests such as family, professional, economic, social, cultural and other interests".
Immigrated or emigrated population is the population that changed its place of usual residence on the territory of the Republic of Croatia or that changed its country of usual residence for a period that is, or is expected to be, of at least one year.
Net migration of population (migration balance) is the difference between the number of immigrants and the number of emigrants of a particular area or country in a given period of time.
Territorial constitution
The data are presented by territorial constitution according to the Act on the Territories of Counties, Towns and Municipalities in the Republic of Croatia (NN, No. 86/06), with the situation as on 31 December 2022.
|
Abbreviations
|
|
| |
|
| NN |
Narodne novine, official gazette of the Republic of Croatia |
| '000 |
thousand |
Published by the Croatian Bureau of Statistics, Zagreb, Ilica 3, P. O. B. 80.
Phone: (+385 1) 48 06 111
Press corner: press@dzs.hr
Persons responsible:
Dubravka Rogić-Hadžalić, Director of Demographic and Social Statistics Directorate
Lidija Brković, Director General
Prepared by:
Tatjana Radić and Andrea Zebec
USERS ARE KINDLY REQUESTED TO STATE THE SOURCE.
Customer Relations and Data Protection Department
Information and user requests
Phone: (+385 1) 48 06 138, 48 06 154
E-mail: stat.info@dzs.hr
Subscription
Phone: (+385 1) 48 06 115
E-mail: prodaja@dzs.hr

